
This post was originally published on this site
The SPDR S&P 500 ETF’s big rally last week was very rare, as it accomplished something that has happened only three other times since its inception 30 years ago.
But rare doesn’t make it bullish, as history suggests there’s a good chance the SPDR ETF
SPY,
which is also known as Spider, will suffer through some weakness over the next few weeks.
Jonathan Krinsky, technical analyst at BTIG, pointed out that the SPY ended last week with three-straight “true-gaps” higher. A “true gap” up is when a daily charted instrument’s intraday low is above the previous session’s intraday high, leaving an empty space in the chart.

SPDR SPY has back-to-back-to-back gap ups for just the 4th time in 30 years.
FactSet, MarketWatch
The SPY low on Friday of $433.01 was 0.5% above Thursday’s intraday high of $430.92, Thursday’s low ($426.56) was 0.7% above Wednesday’s high ($423.50), and Wednesday’s low ($418.65) was above Tuesday’s high of $418.53.
Since SPY started trading in January 1993, it has only had three straight gap-ups three other times: the three-session stretches that ended March 13, 2019, Oct. 12, 2020, and March 31, 2023, according to BTIG’s Krinsky.
Of those three, only the 2020 triple gap-up was the most like last week’s, as the final two gaps had at least 0.3% of space in the charts.
What followed after that gap-up streak was a three-week selloff, in which the SPY fell as much as 7.3% to a five-week low of $326.54 on Oct. 30, 2020, before resuming their rally.
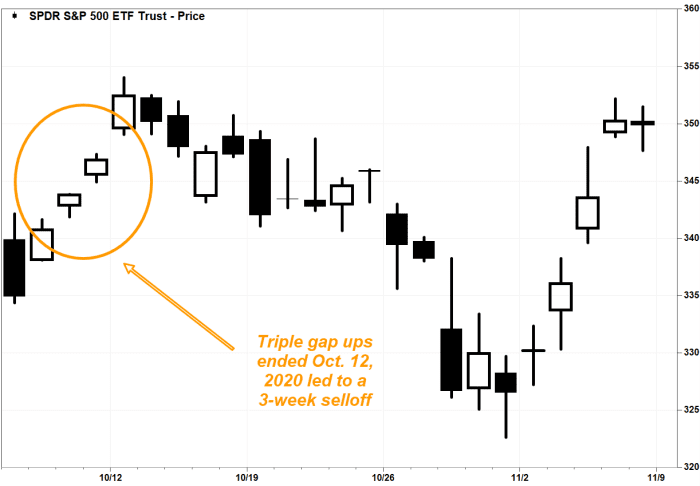
SPY fell for the next 3 weeks following the 2020 triple gap-ups.
FactSet, MarketWatch
On Friday, the SPY rose as much as 0.3% after the open, before reversing course to be down 0.1% in afternoon trading.
After the 2019 triple gap-ups, the SPY traded sideways for the next few weeks, with a low point of $279.04 on March 25, or 0.8% below where the gap-ups closed.
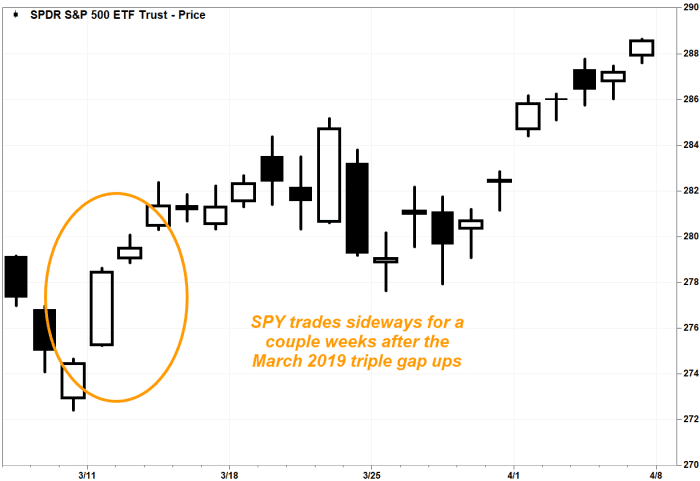
SPY traded sideways for a couple of weeks after March 2019 triple gap-ups.
FactSet, MarketWatch
And following the 2023 triple gap-ups, the SPY bounced around in a relatively narrow range for about six weeks. The closing low of that range was $404.36 on April 26, or 1.2% below where the gap-up streak ended.
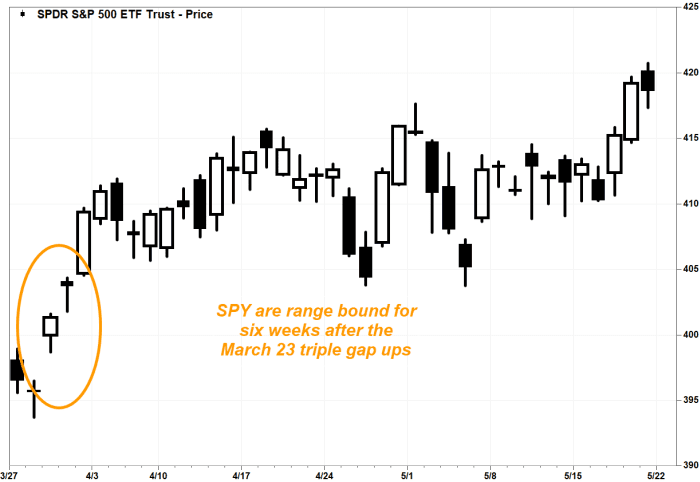
SPY is stuck in a range for about 6 weeks after the 2023 triple gap-ups.
FactSet, MarketWatch
Krinsky noted that a sample size of just four triple gap-ups in 30 years is “statistically irrelevant,” but said it shows “how rare last week’s action was.”
Many chart watchers believe that eventually, price gaps in charts will be “filled,” meaning the charted instruments will at some point trade at prices separated by the gaps sometime in the future.
While Krinsky said his research indicates that not all gaps get filled, he believes that all three of last week’s gaps below will be filled, before the ones above current prices do.
The first price gap above current prices is the one between the Sept. 20, 2023 low of $438.43 and the Sept. 21 high of $435.97. Above that, there’s a gap between the Sept. 14 low of $447.71 and the Sept. 15 high of $447.48.
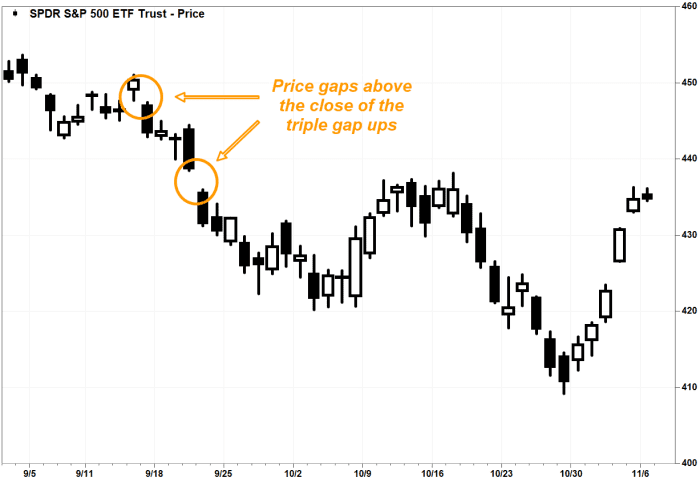
BTIG’s Krinsky believes last week’s gaps are filled before September’s gaps are filled.
FactSet, MarketWatch
That means Krinsky believes the SPY will trade at least 3.7% below Friday’s closing price of $434.69, before it rallies 2.9%.

