
This post was originally published on this site
This could be a good time for investors to pour money into stocks of companies involved in the production of oil and natural gas. And the best reason for that may have nothing to do with military conflict.
Nearly a month has passed since the latest disruption in the Middle East began with the attack by Hamas on Israel on Oct. 7. Because of Iran’s importance to the world oil market, its stated hostility to Israel and its support for Hamas, Hezbollah and other groups targeting Israel, investors might have expected oil prices to soar. But that hasn’t happened. Here’s a one-year chart showing price movement of front-month contracts for West Texas crude oil
CL00,
:
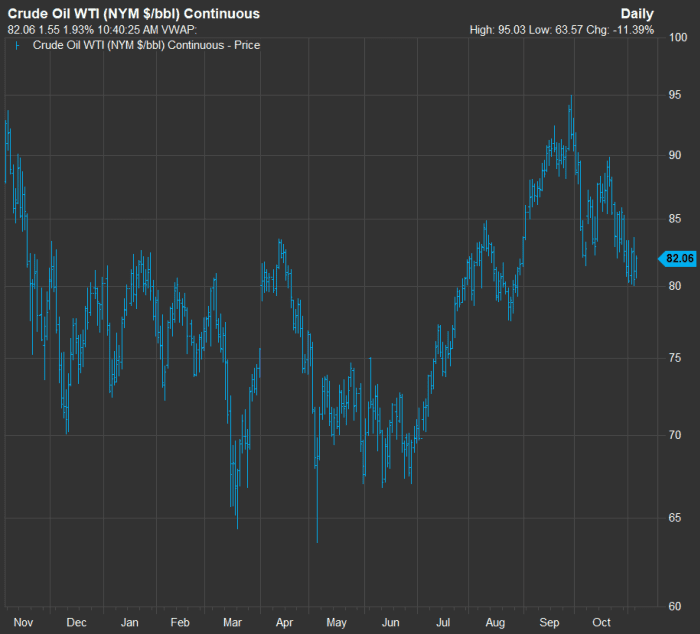
The price of front-month contracts for West Texas crude oil has actually declined slightly since Hamas attacked Israel on Oct. 7.
FactSet
WTI has been trading for about $82 a barrel, even following Saudi Arabia’s latest effort to prop up prices by extending a production cut. It is down from $82.79 on Oct. 6, before Hamas’s attack on Israel.
Gabelli analyst Simon Wong believes slow demand for oil has had a larger effect on recent price movement than the Israel-Hamas war or the continuing conflict between Russia and Ukraine. “Maybe we have added a $5 to $10 geopolitical risk premium” to the price of oil per barrel, he said during an interview with MarketWatch.
“Peak demand season for oil and gasoline is over by Labor Day. Typically we build inventory from October to the end of the first quarter or middle of the second quarter,” he said.
Wong went on to say that “the U.S. is the only region in the world where demand is holding up.”
With no way of predicting whether Iran will become more directly involved in hostilities, which might disrupt its oil exports and cause oil prices to shoot up, investors might be better off counting on weak seasonal demand to set up good buying opportunities.
The largest U.S. industry players have already jumped on the opportunity to add exposure to attractive drilling acreage or to large offshore drilling projects. One easy way to invest in the largest U.S. players in the oil patch as a group is the Energy Select Sector SPDR exchange-traded fund
XLE,
which holds shares of all 23 stocks in the energy sector of the S&P 500
SPX.
Following Exxon Mobil Corp.’s
XOM,
agreement to acquire Pioneer Natural Resources Co.
PXD,
for about $59.5 billion and Chevron Corp.’s
CVX,
deal to acquire Hess Corp.
HES,
for about $53 billion (both will be all-stock transactions), the natural questions for investors are:
- Which other U.S. industry players may be ripe for acquisition?
- What U.S. energy stocks are priced most attractively?
To answer the first question, Wong referred to speculation that ConocoPhillips
COP,
was considering making a bid for the privately held CrownRock. In September, Reuters reported that CrownRock was considering a sale.
Wong continued, saying that there were potential targets among publicly traded operators in the Permian Basin, in western Texas and southeast New Mexico. Pioneer is a major operator there. Other potential targets focused in that shale basin that Wong named are Callon Petroleum Co.
CPE,
Permian Resources Corp.
PR,
Diamondback Energy Inc.
FANG,
Vital Energy Inc.
VTLE,
and SM Energy Co.
SM,
Gabelli holds shares of Callon and Diamondback in funds it manages, he said.
Three energy-stock screens
So there you have five potential Permian targets following the takeout deals for Pioneer and Hess.
But what about other cheaply priced energy stocks? Wong said that he conducts his own analysis for Gabelli to help fund managers decide which industry stocks to buy. He focuses on price-to-book value and free cash flow.
For a simple analysis of a large group of companies, we can begin with the 70 stocks in the energy sector of the S&P 1500 Composite Index
XX:SP1500,
which is made up of the S&P 500, the S&P 400 Mid Cap Index
MID
and the S&P Small Cap 600 Index
SML.
Let’s screen these 70 companies three ways. First, we will screen price/book value ratios. Then we will screen for trailing free-cash-flow yields. Then, for the companies for which consensus estimates are available, we will look at forward free-cash-flow yields.
A company’s free cash flow is its remaining cash flow after capital expenditures. This is money that can be used to pay dividends, to repurchase shares, for acquisitions or expansion or for other corporate purposes. Buybacks that are large enough to lower the share count will raise earnings and cash flow per share.
Free cash flow can swing significantly for companies in the oil industry because of investment patterns and price movement.
If we divide a company’s annualized free cash flow per share by its current share price, we have a free-cash-flow yield. This can be one of many things to consider when selecting an investment. You can compare the trailing or expected free-cash-flow yield with a company’s dividend yield, for example.
All three data elements, if available, will be included for all three screens.
Price to book value
First, here are the 10 oil companies in the S&P Composite 1500 trading lowest to book value per share:
| Company | Ticker | Price/ book value | Trailing FCF yield | Forward FCF yield | Dividend yield |
| World Kinect Corp. |
WKC, |
0.62 | -17.35% | N/A | 2.75% |
| Callon Petroleum Co. |
CPE, |
0.64 | -4.52% | N/A | 0.00% |
| Vital Energy Inc. |
VTLE, |
0.64 | -47.05% | 17.97% | 0.00% |
| Oil States International Inc. |
OIS, |
0.71 | 7.37% | N/A | 0.00% |
| PBF Energy Inc. Class A |
PBF, |
0.84 | 24.23% | 7.39% | 2.17% |
| CNX Resources Corp. |
CNX, |
0.90 | 8.23% | N/A | 0.00% |
| Dril-Quip Inc. |
DRQ, |
0.90 | -7.92% | 10.38% | 0.00% |
| Talos Energy Inc. |
TALO, |
0.93 | 6.70% | N/A | 0.00% |
| Helix Energy Solutions Group Inc. |
HLX, |
1.00 | 3.99% | N/A | 0.00% |
| HF Sinclair Corp. |
DINO, |
1.04 | 25.12% | N/A | 3.20% |
| Source: FactSet | |||||
Free cash flow estimates aren’t available for most of the companies in this first group.
Among the five potential Permian Basin targets named by Wong, Callon and Vital Energy made this first list.
The dividend yields in the following tables include FactSet’s calculations for regular fixed and variable dividends paid over the past year. Some energy companies include a variable component to their regular quarterly dividend payments, on top of a fixed portion. So if the dividend is an important part of your decision, you need to read up on the dividend policy for any company you are considering for investment.
Trailing free-cash-flow yield
Here are the 10 oil companies in the S&P Composite 1500 with the highest free-cash-flow yields, based on the past four reported quarters, according to FactSet:
| Company | Ticker | Trailing FCF yield | Forward FCF yield | Dividend yield | Price/ book value |
| Par Pacific Holdings Inc, |
PARR, |
50.22% | N/A | 0.00% | 2.16 |
| CVR Energy Inc. |
CVI, |
27.04% | N/A | 6.13% | 3.43 |
| Marathon Petroleum Corp. |
MPC, |
25.61% | 17.61% | 2.19% | 2.25 |
| HF Sinclair Corp. |
DINO, |
25.12% | 4.55% | 3.20% | 1.04 |
| Valero Energy Corp. |
VLO, |
24.96% | 18.10% | 3.23% | 1.66 |
| PBF Energy Inc. Class A |
PBF, |
24.23% | 7.39% | 2.17% | 0.84 |
| U.S. Silica Holdings Inc. |
SLCA, |
20.12% | N/A | 0.00% | 1.13 |
| Consol Energy Inc. |
CEIX, |
20.05% | N/A | 3.32% | 2.33 |
| Nabors Industries Ltd. |
NBR, |
16.03% | N/A | 0.00% | 2.74 |
| Coterra Energy Inc. |
CTRA, |
15.72% | 6.79% | 2.85% | 1.67 |
| Source: FactSet | |||||
All the companies listed or screened in this article are involved with oil or natural-gas production, refining, transportation or related services, except Consol Energy Inc.
CEIX,
which produces and distributes coal.
Forward free-cash-flow yield
Here are the 10 oil companies in the S&P Composite 1500 with the highest forward free-cash-flow yields, based on consensus estimates among analysts polled by FactSet:
| Company | Ticker | Forward FCF yield | Trailing FCF yield | Dividend yield | Price/ book value |
| Civitas Resources Inc. |
CIVI, |
20.52% | 15.27% | 10.34% | 1.22 |
| Valero Energy Corp. |
VLO, |
18.10% | 24.96% | 3.23% | 1.66 |
| Vital Energy Inc. |
VTLE, |
17.97% | -47.05% | 0.00% | 0.64 |
| Marathon Petroleum Corp. |
MPC, |
17.61% | 25.61% | 2.19% | 2.25 |
| Murphy Oil Corp. |
MUR, |
15.40% | 8.09% | 2.40% | 1.33 |
| Permian Resources Corp. Class A |
PR, |
13.14% | 8.15% | 1.35% | 1.43 |
| Marathon Oil Corp. |
MRO, |
12.53% | 12.91% | 1.49% | 1.44 |
| Phillips 66 |
PSX, |
12.37% | 13.58% | 3.60% | 1.67 |
| Liberty Energy Inc. Class A |
LBRT, |
11.30% | 10.44% | 1.38% | 1.91 |
| APA Corp. |
APA, |
11.14% | 13.63% | 2.50% | 17.32 |
| Source: FactSet | |||||
Among the five potential Permian takeout targets named by Wong, Vital Energy and Permian Resources made this last list.
Click on the tickers for more about each company or index.
Don’t miss: India is seeing a multidecade growth surge. Here’s how you can invest in it.

