
This post was originally published on this site
Introduction
The last few months have largely been a horrible conundrum for many income investors, as they face interest rates sinking to record lows amidst the economic crisis that has also resulted in many dividends being reduced or completely suspended. Thankfully, there are still several opportunities available, such as the international tobacco giant Philip Morris (PM) that offers a sizeable dividend yield that is not only sustainable but also whose share price still offers returns that are stacked in a favorable direction.
Background
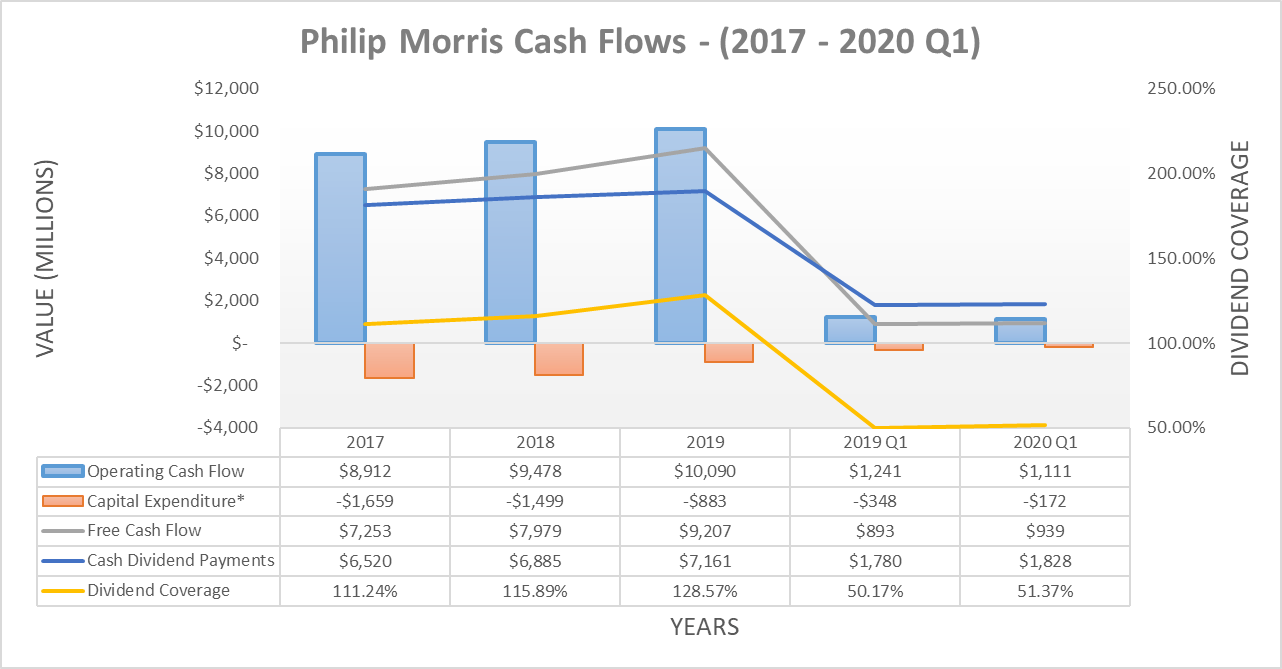
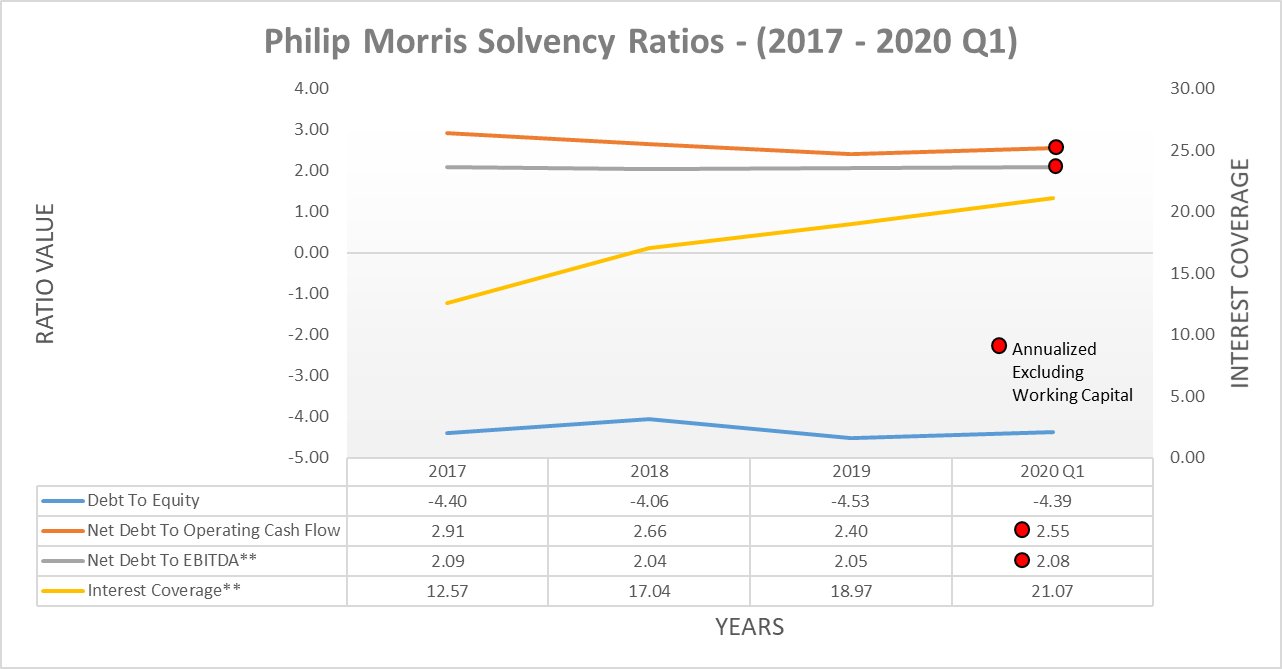
Whilst many companies are suffering from collapsing earnings due to this coronavirus economic crisis, the tobacco industry is mostly well-positioned due to the inelastic nature of the demand for their products. This allows them to hold up well regardless of economic conditions, but it also tends to mean that their sales do not boom during a recovery. During periods of time such as these, there are few companies in such a strong position that are still generating ample free cash flow with reasonable leverage, see the two graphs included below.
![]()
Source: Author.
Whilst their low dividend coverage during the first quarter of 2020 may alarm some investors, it should be remembered that this was only due to normal working capital movements. If these were removed, their dividend coverage would have increased to a respectable 116.25%. Overall, there are few reasons to believe that their dividend will not at least be sustained at its current level during the foreseeable future, a view that is also shared by others. Since I recently discussed their dividend sustainability in greater detail a couple of months ago, please refer to my previous article as nothing material has changed since publishing.
Even though there have been concerns during recent years regarding their cigarette volume declines, in the grand scheme, these are yet to be a reason for concern. Whilst their cigarette volume decline of 4.43% year on year during the first quarter of 2020 is certainly not ideal, there have been numerous other times where they have suffered equal or larger declines, as the graph included below displays.
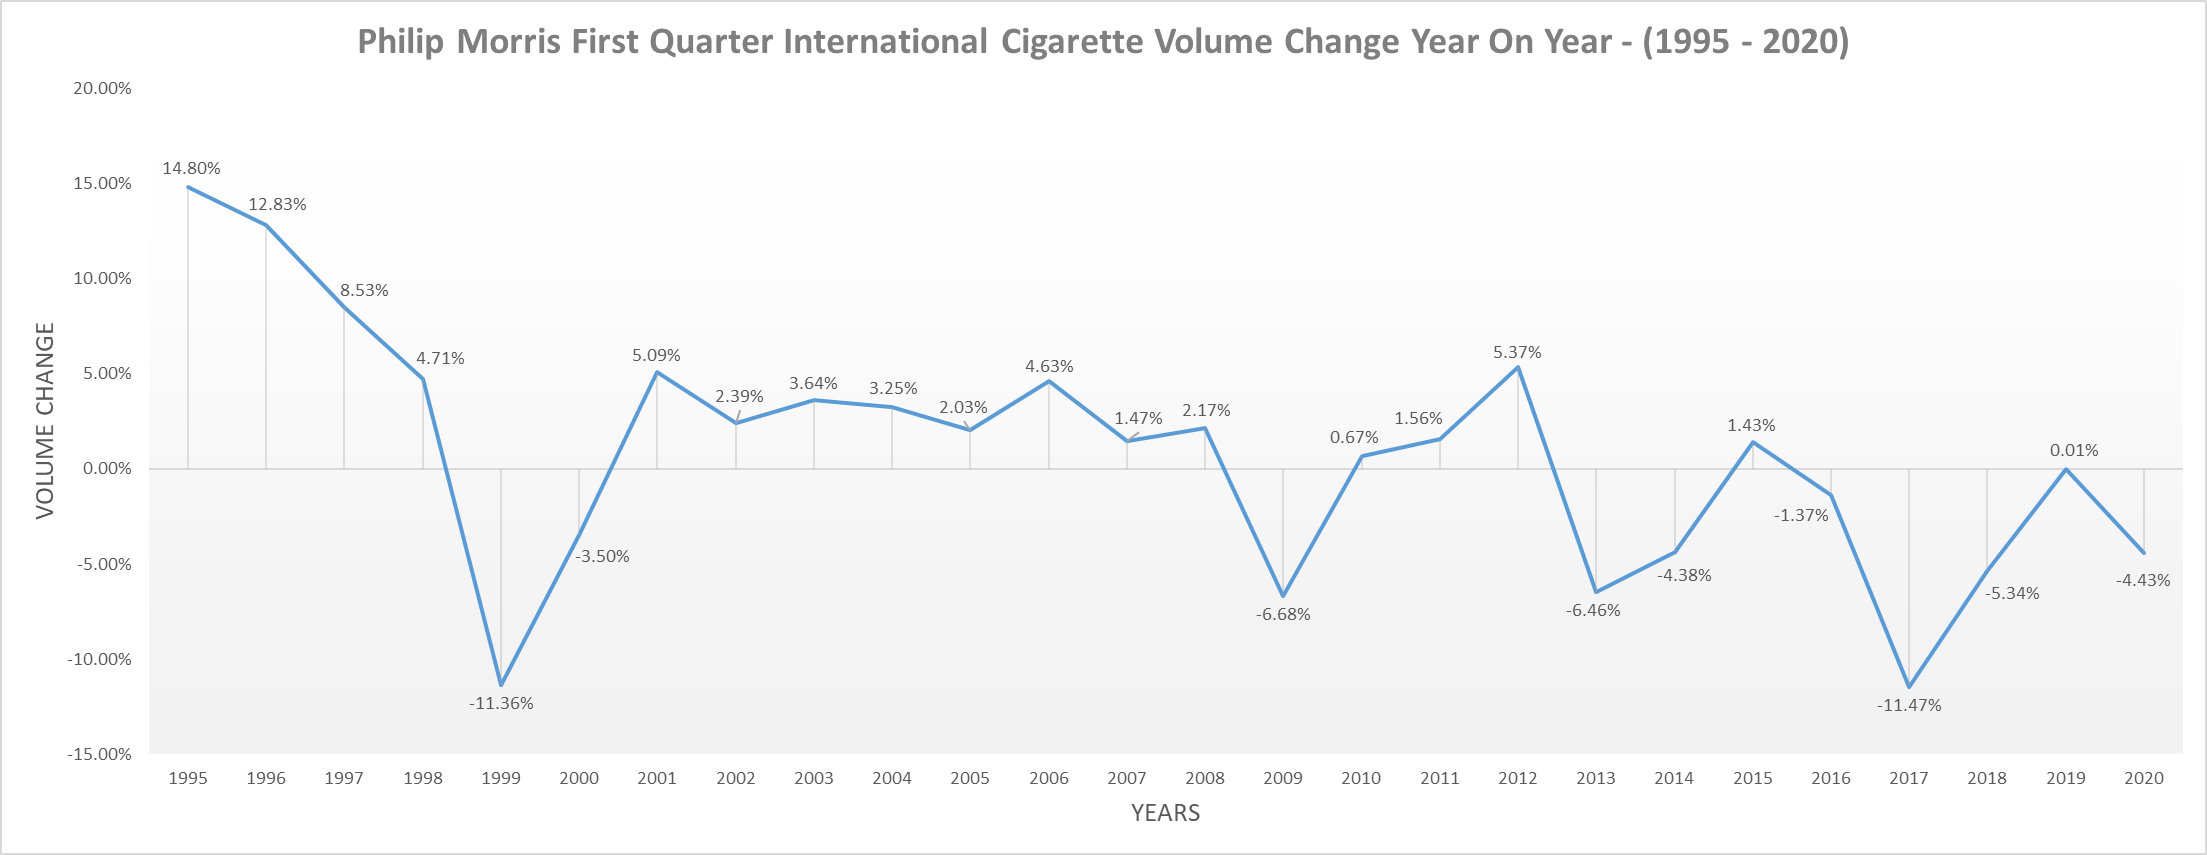
Source: Author.
Thankfully, their investments in IQOS have been bearing fruit, with volumes consistently regaining their growth trajectory during the last two years, as the graph included below displays. These materially compensate for their lost cigarette volumes, with their combined volumes only declining a small 1.17% year on year during the first quarter of 2020.
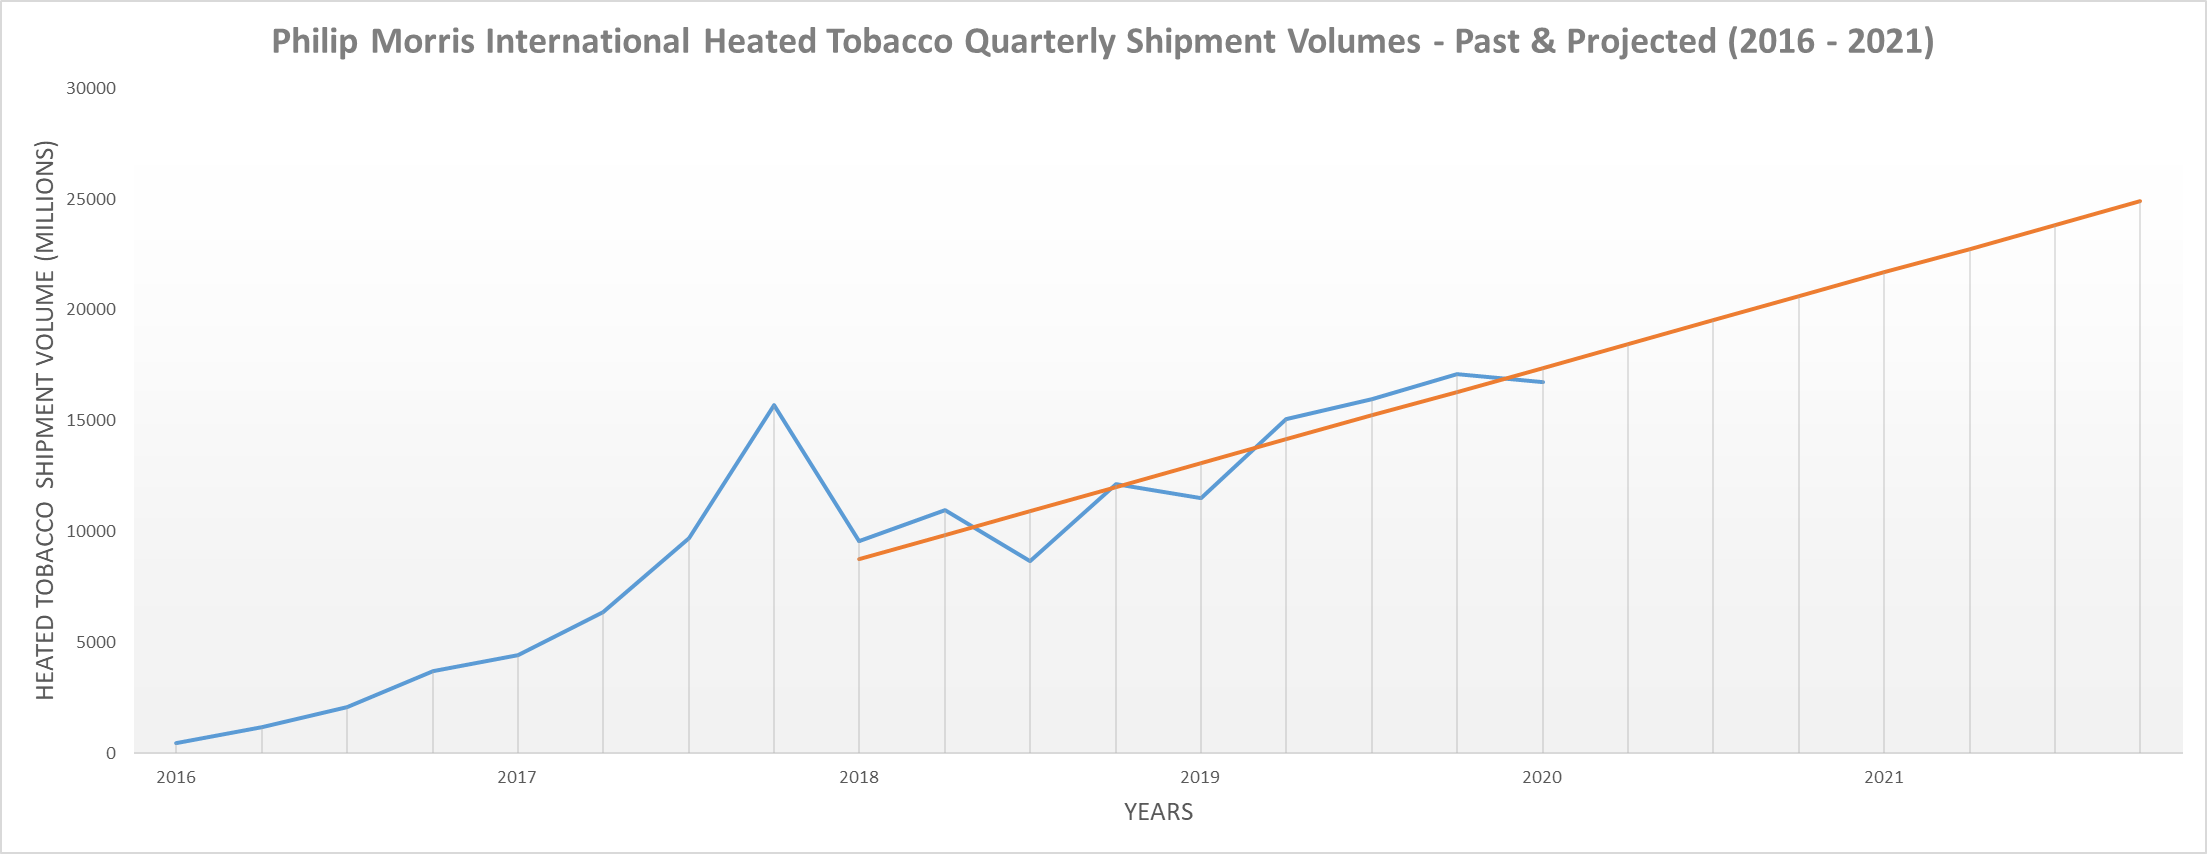
Source: Author.
Discounted Cash Flow Valuations
The discounted cash flow valuation assumed that their quarterly dividend remains unchanged perpetually into the future at $1.17 per share or $4.68 per share on an annual basis. This was selected to incorporate a significant margin of safety, in case the medium to long-term secular decline in tobacco demand eliminates their growth, despite their IQOS investments.
The valuation produced a result of $75.36 per share, which indicates that their intrinsic value is 6.97% higher as of the time of writing. Whilst this indicates that their share price is already quite close to their intrinsic value, it should be remembered that this was only a very conservative baseline valuation that assumes zero future dividend growth. Based on their historical ten-year compounded annual dividend growth rate of 7.51%, adequate dividend coverage, modestly strong financial position, and inelastic demand, it seems reasonable to believe that growth will be forthcoming. This was done primarily to illustrate that even if their future performance is underwhelming compared to their past, in theory, shareholders should see little to no losses in the long term as they are not paying anything for potential future growth.
This valuation used a cost of equity as determined by the Capital Asset Pricing Model that utilized a 60M Beta of 0.80 (SA), expected market return of 7.50% and risk-free rates as per the United States Treasury Yield Curve on the 22nd May 2020, which reflects that risk-free rates are higher in the long term than the short term. Admittedly, this intrinsic value is partly being boosted by the current very low risk-free rates as well as only moderate expected market returns. Since the discount rate is arguably the most contentious assumption, I have provided a Monte Carlo Simulation with a wide range of 121 different cost of equity assumptions. These include expected market returns from 5% to 10% and risk-free rates from 0% to 5%, both of which used 0.5% increments.
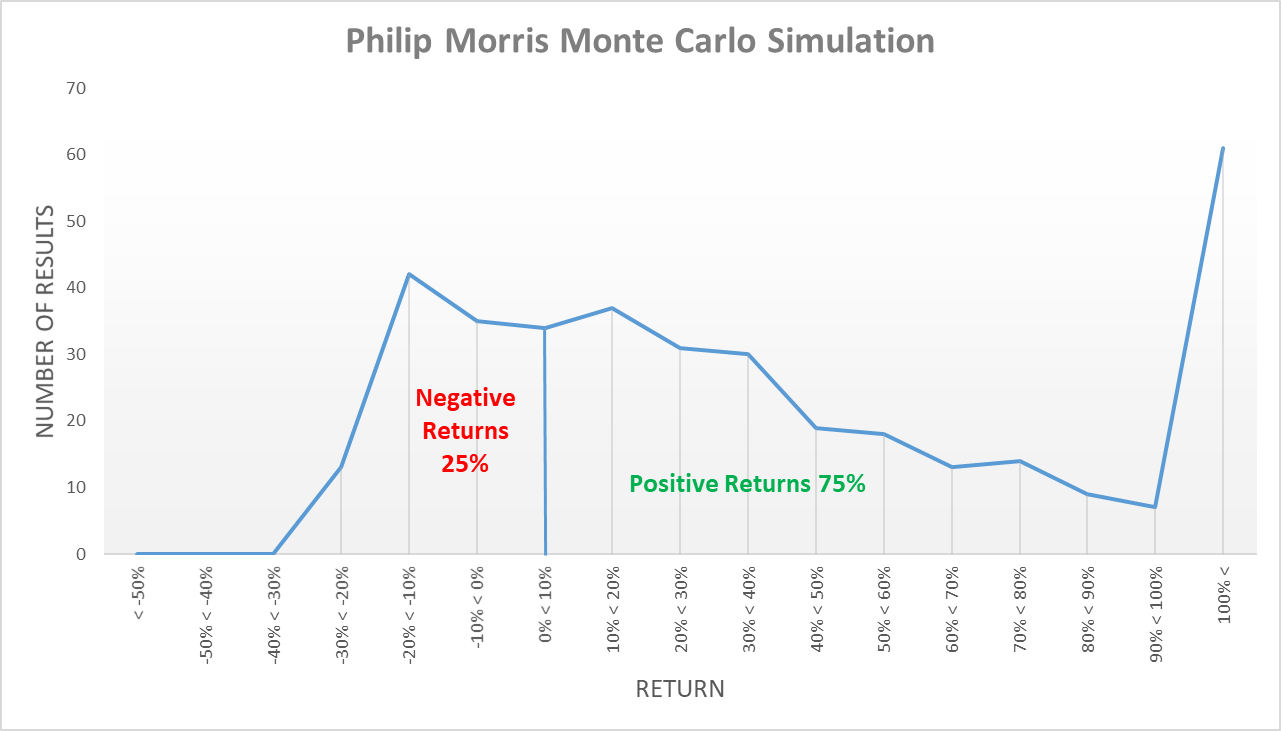
To further illustrate how their odds are stacked favorably in the long term, I have included an additional two scenarios relating to their future dividends. The first scenario is bearish and foresees their current dividend being reduced by 25% before growing at 2.50% per annum perpetually into the future. Meanwhile, the second scenario is the most bullish and foresees their current dividend avoiding any reductions and subsequently growing at 2.50% per annum perpetually into the future.
When these two new scenarios are combined with the original zero growth scenario and the 121 different costs of equity assumptions, it provides a total of 363 different valuations. Most importantly, it can be seen in the graph below that 75% of these results are positive and few of the negative results are large losses. Even if all the results above 100% return are judged to be too extreme and thus are excluded, the positive returns still form 70% of the total returns. This further highlights how the odds are stacked in a favorable direction for shareholders in the long-term, as the majority of valuations produce an intrinsic valuation above their current share price as of the time of writing.
Source: Author.
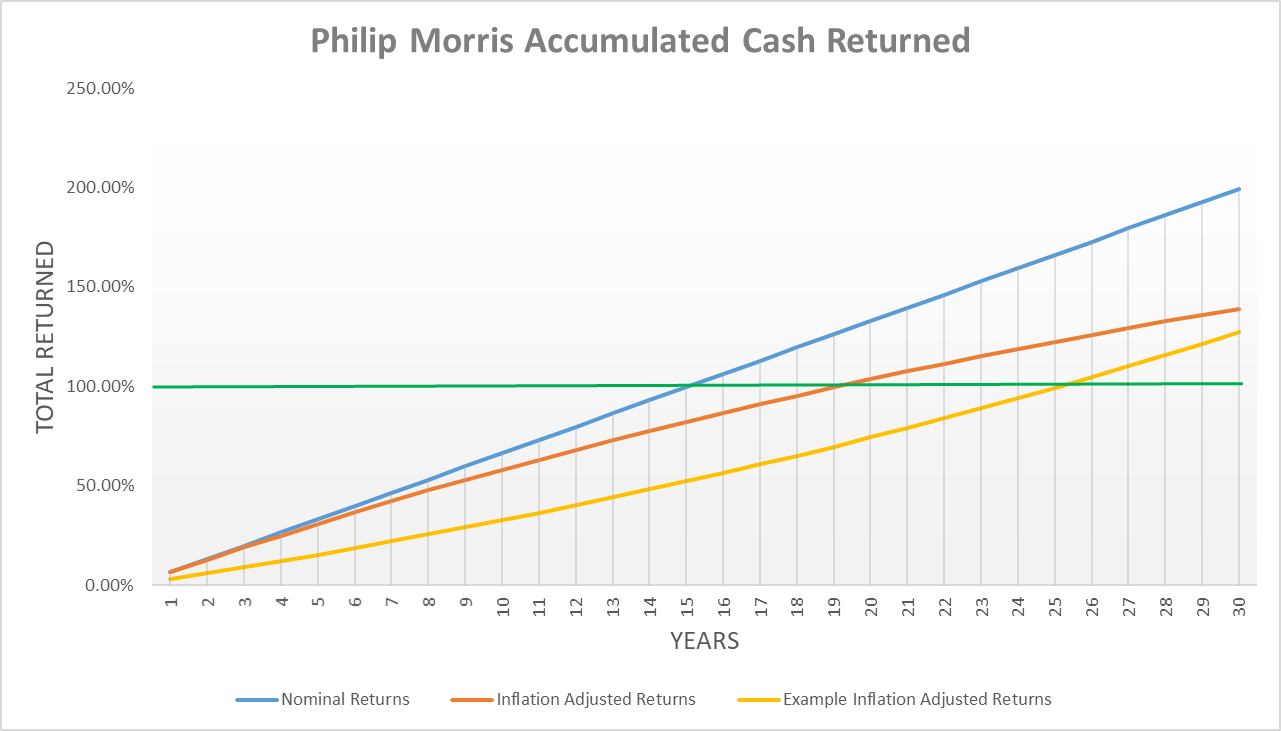
I believe that reviewing the payback period of a dividend stream is especially important for companies that are facing secular declines, such as those in the tobacco industry, as the quicker a shareholder sees their capital returned, the less their probability of losing money. After reviewing the graph included below, it can be seen that it takes around 15 and 19 years for their dividends to repay the initial investment in nominal and inflation-adjusted terms respectively. The example was included to provide the context of what to expect from a more standard investment with a 3% dividend yield that grows at 5% per annum. It can be seen that despite its significantly higher growth rate, its inflation-adjusted payback period is significantly longer at 25 years, which is less attractive than 19 years.
Source: Author.
Relative Valuations
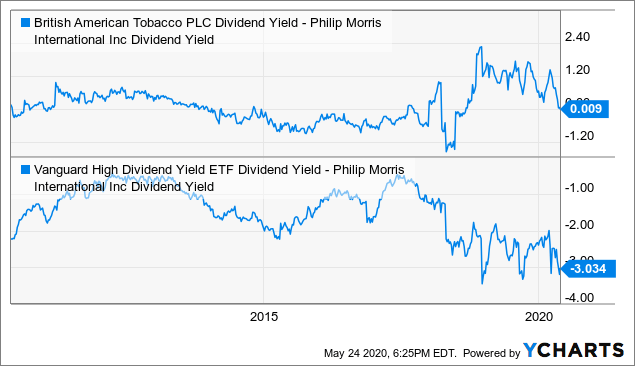
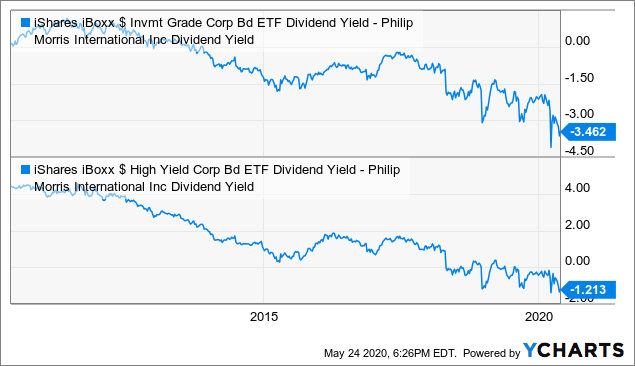
Since this analysis has primarily focused on their dividends, which is also the primary aspect that their shareholders desire, the relative valuation compares the spread between their dividend yield and that of alternative income-producing investments. To simplify interpreting these graphs, a lower spread indicates a lower relative valuation and largely speak for themselves. Whilst their current spread to their main peer, British American Tobacco (BTI), is approximately neutral, the remaining three show that their current dividend yield exceeded that of the selected alternative income investments to the most significant extent during the last decade. This indicates that relatively speaking their shares are materially undervalued and thus represent attractive value.
Rule Of Thumb Valuation
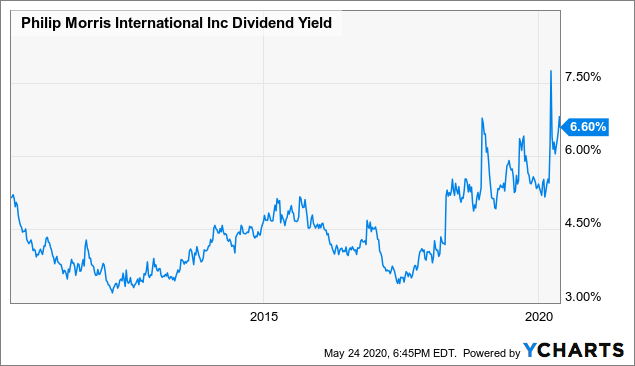
Whilst I find analyzing different quantitative valuations quite interesting since no single approach is perfect, it nonetheless is still useful to consider a simple rule of thumb approach. Provided an investor believes that they can at least keep their dividend steady going into the future, based on their history, it would not be unrealistic to expect their dividend yield to revert to 5%, as seen in the graph below.
Even without any further dividend increases, this would still require their share price to increase by 32.86%. Even if this took three years, shareholders would receive an additional 6.60% per annum from dividends for a potential total return of 52.66% or a gross potential annualized return of 15.14%. This would certainly propel any portfolio higher and does not require them to provide any dividend growth, which as previously discussed is likely to be forthcoming and thus provides a margin of safety to this valuation.
Conclusion
Whilst the tobacco industry may not necessarily suit all investors, it nonetheless still provides a reasonably safe harbor for those seeking strong dividend income whilst vast amounts of other companies reduce their dividends. Although these results are favorable and certainly warrant a place in a dividend income portfolio, they are not as extremely favorable as those for Altria (MO), as discussed in one of my recent articles. Given this, I believe that maintaining my bullish rating is appropriate, as they are not quite favorable enough to justify a very bullish rating.
Notes: Unless specified otherwise, all figures in this article were taken from Altria’s and Philip Morris’ SEC filings contained in the following four links (1)(2)(3)(4) and all calculated figures were performed by the author.
Disclosure: I am/we are long PM, MO, BTI. I wrote this article myself, and it expresses my own opinions. I am not receiving compensation for it (other than from Seeking Alpha). I have no business relationship with any company whose stock is mentioned in this article.

