
This post was originally published on this site
The USD/CAD currency pair, which expresses the value of the U.S. dollar in terms of the Canadian dollar, can perhaps be viewed as a risk-off pair since the Canadian dollar is heavily correlated to the performance of the oil market. The U.S. dollar, meanwhile, is the world’s reserve currency; a natural safe haven in the FX space, which tends to rally just as (dollar-denominated) oil prices fall.
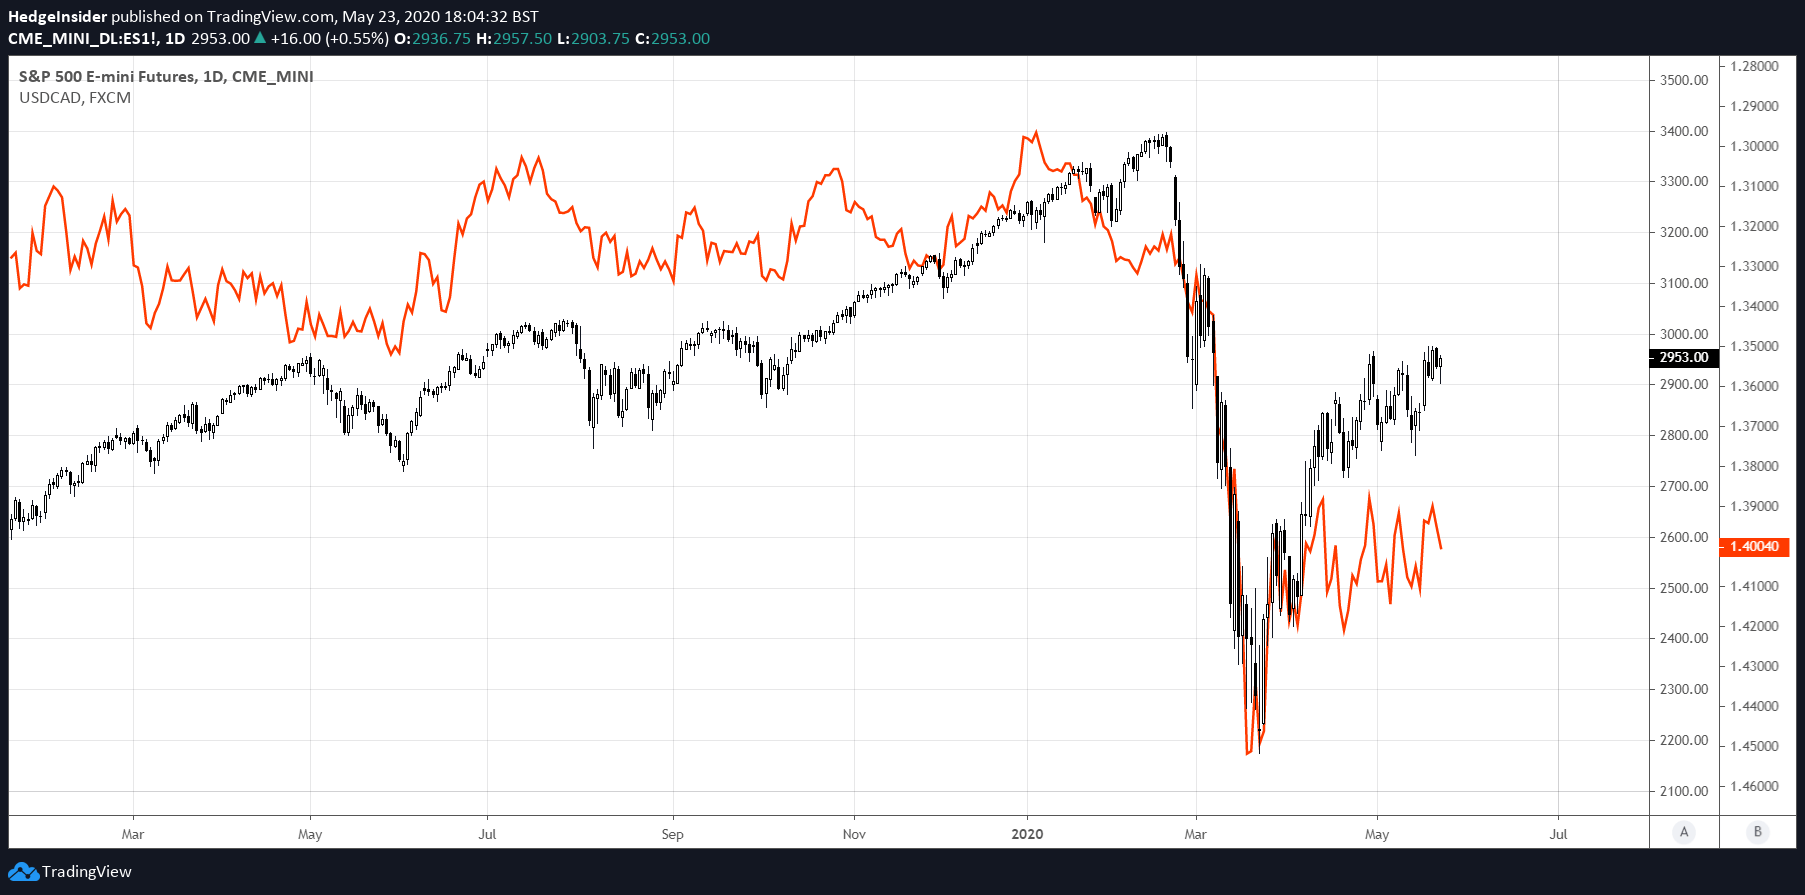
The chart below shows front-month E-Mini S&P 500 futures prices (as a proxy for both U.S. equities and general risk sentiment), illustrated by daily candlesticks, while USD/CAD (inverted) is illustrated by the colored line set against the far-right y-axis. I have inverted USD/CAD since it is CAD that correlates positively with risk assets including oil.
 (Chart created by the author using TradingView. The same applies to all subsequent candlestick charts presented hereafter.)
In a derivative sense, if you are bullish on equities, you are probably short USD/CAD (i.e., long CAD versus USD) and vice versa. This is because just as oil prices tend to drive moves in the Canadian dollar, they also tend to drive moves in global risk sentiment (especially if the market senses that changes in demand are having an out-sized effect on oil prices, rather than changes in supply).
Of course, both supply and demand are important; prices are discovered as the two meet at an equilibrium. In April 2020 we saw negative prices for the first time in WTI Crude Oil Futures; did this result from excess supply, or a dearth of demand? Technically, the answer is either of these, since the problem of negative prices could have been fixed had either supply vanished or demand surged.
Yet in a broader context, it is clear that it was more of a demand problem, given that economies across the world have been locked down in response to the COVID-19 pandemic. The fact that buyers in the end could not even be paid enough to take ownership of WTI crude oil confirmed that there was a demand-side problem. Supply and demand are conceptually reflexive though; the lack of demand created excess supply (there was not enough cost-effective storage to take ownership of crude, as oil prices sunk below zero). Again, we have to consider the nature of the fall in oil prices, and it was primarily demand driven.
As countries start to ease lock-down restrictions, and as businesses start to return to work, we have seen oil prices climb impressively over the past few weeks. This has occurred alongside equities, as indicated by the chart below, which illustrates S&P 500 futures with daily candlesticks and Crude Oil futures with the red line.
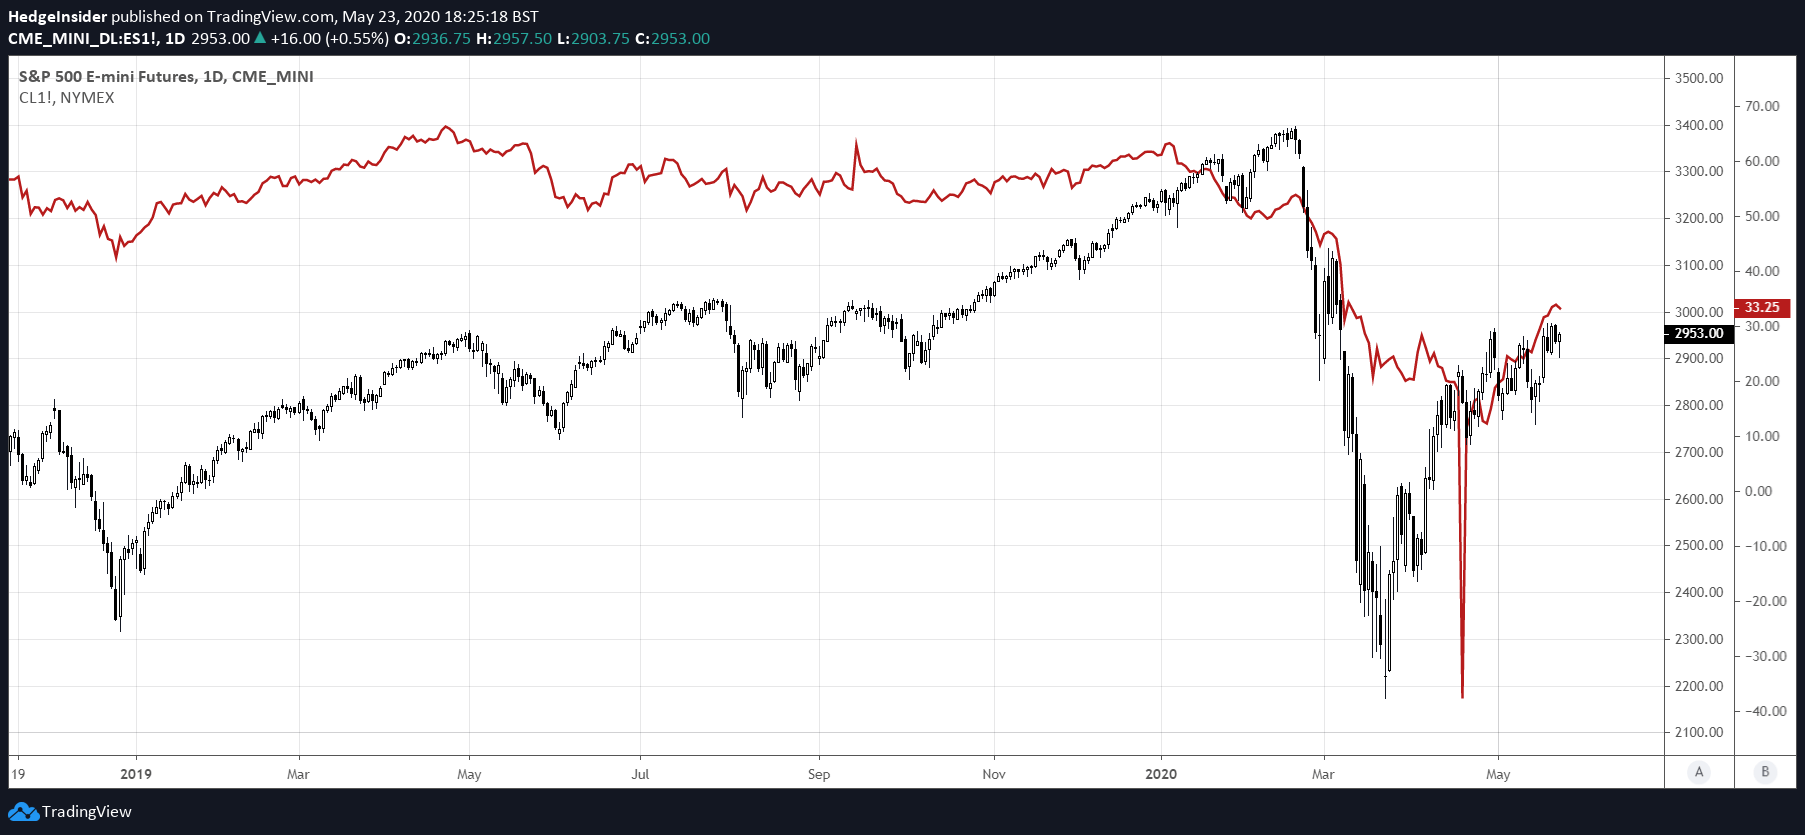 The rebound has evidently helped to stem CAD outflows, as USD/CAD has eased off its recent highs. The pair is currently staying well under the 1.46 handle, which it was able to breach in March 2020; the month in which the recent equity crash produced significant demand for USD, just as oil prices were falling consistently.
In markets, there are lots of correlations, and these correlations are often non-causal, and/or change quickly or surprisingly. However, in this case, we can draw a line of causation between the strength of the oil market and the Canadian dollar; the latter is, in part, frankly subject to the whims of the former. If oil prices fall, Canada’s terms of trade simply worsens (since Canada is a key exporter of oil products). The oil industry is also important to Canadian GDP (severe contractions can produce longer-term ripple effects, affecting key macroeconomic indicators like inflation and unemployment).
Canada has some other redeeming qualities; it is considered a stable nation politically, and in spite of its oil market exposure, the country is ranked by the Observatory of Economic Complexity as the 24th most sophisticated economy. That is below the likes of Japan, Switzerland, Germany, the United States, the United Kingdom, France, Italy and several other countries. However, it is importantly still above the likes of Australia and New Zealand, which are far less sophisticated (ranking 59th and 41st, respectively). While CAD may be considered a commodity currency, AUD and NZD are generally considered to be the “purer” commodity currencies.
Therefore, oil prices drive CAD, and oil prices (especially if driven by demand-side factors) can drive broader risk sentiment. Oil prices recently fell on mostly demand-side factors, which produced a spike in USD/CAD and a drop in global equities. More recently, these demand-side factors have begun to ease, and therefore we are now heading in a positive direction for CAD. We are also potentially heading in a positive direction for equities, however the relationship between oil market fundamentals and global equity performance is looser (more correlative than causal).
Focusing on USD/CAD, we may now see that the pair continues to sink lower over the longer term. The chart below uses weekly candlesticks, and shows that USD/CAD has recently breached the 1.46 level which aligns with highs we last saw in January 2016. In fact, the high in January 2016 was about 1.4690, whereas the recent high in March 2020 was 1.4667. The recent high was marginally lower, and hence there is a risk that the market attempts another break of this level in the near term before heading downward.
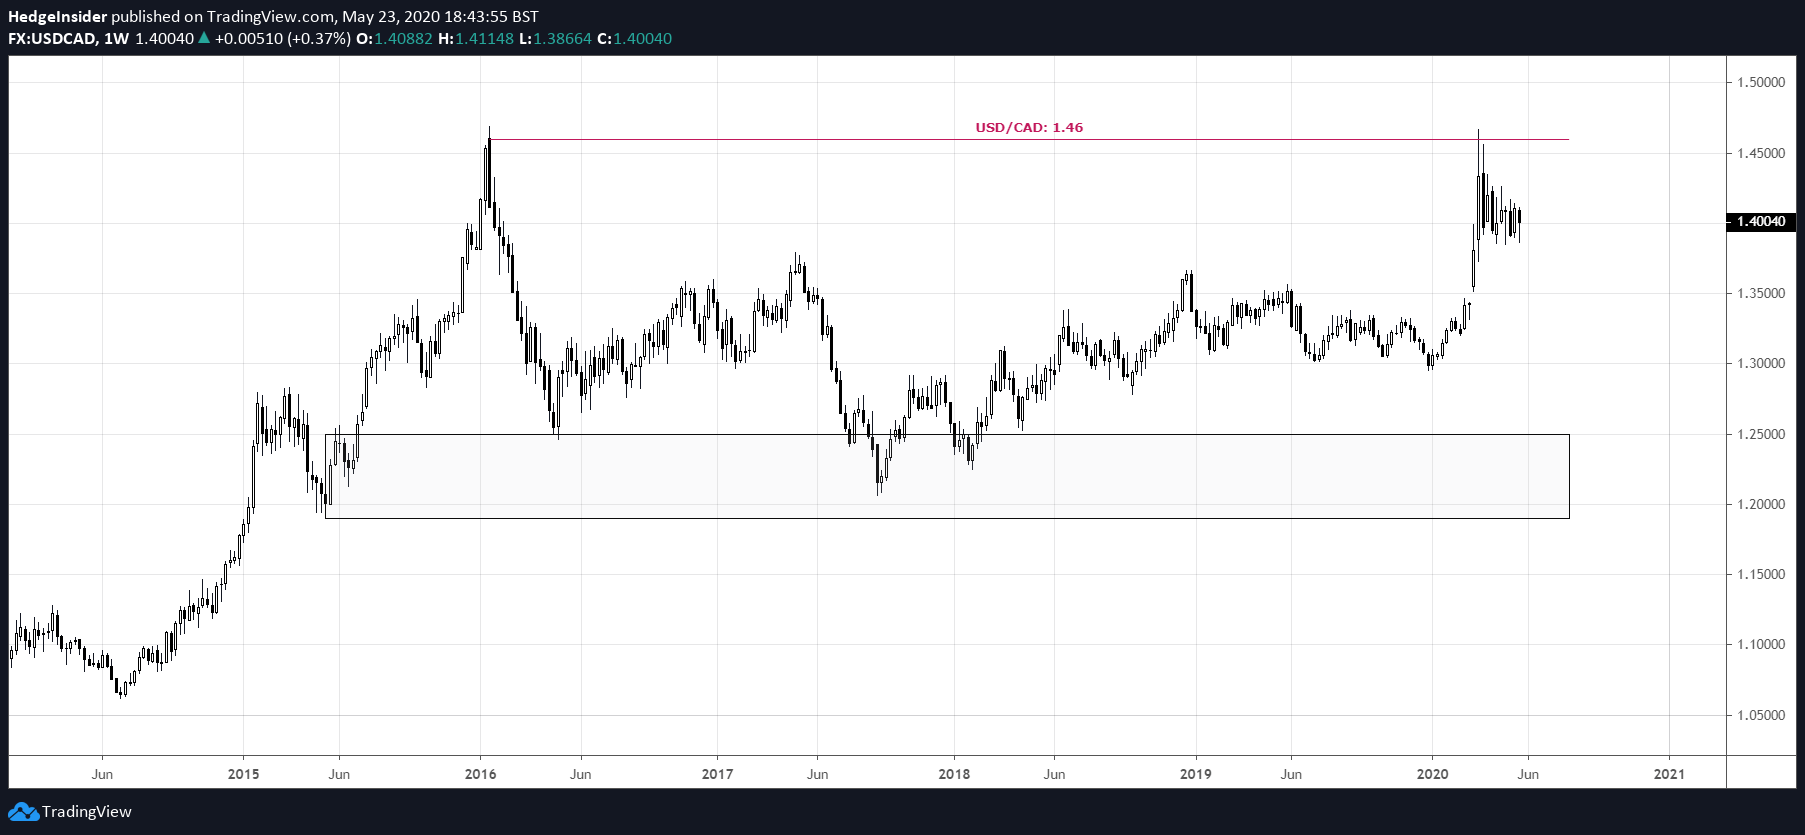 The shaded box area at the bottom of the chart illustrates the range between 1.19 and 1.25, which would be possible long-term target area. Note that USD/CAD has traded within this broad range (between 1.19 and 1.46) since the start of 2015.
If we trust that the oil market does not collapse once again, it is perhaps difficult to see how USD/CAD will sustainably break out of this long-term range to the upside. I believe USD/CAD is more likely to remain within the prevailing trading range; the first target might be to the center (approximately 1.3250).
One last point, is that we should continue to monitor the bond market’s assessment of the long-term prospects of these two economies (the United States and Canada). The chart below shows the spreads between the U.S. 10-year and 2-year treasury yields (the black line) and Canadian 10-year and 2-year bond yields (the colored line).
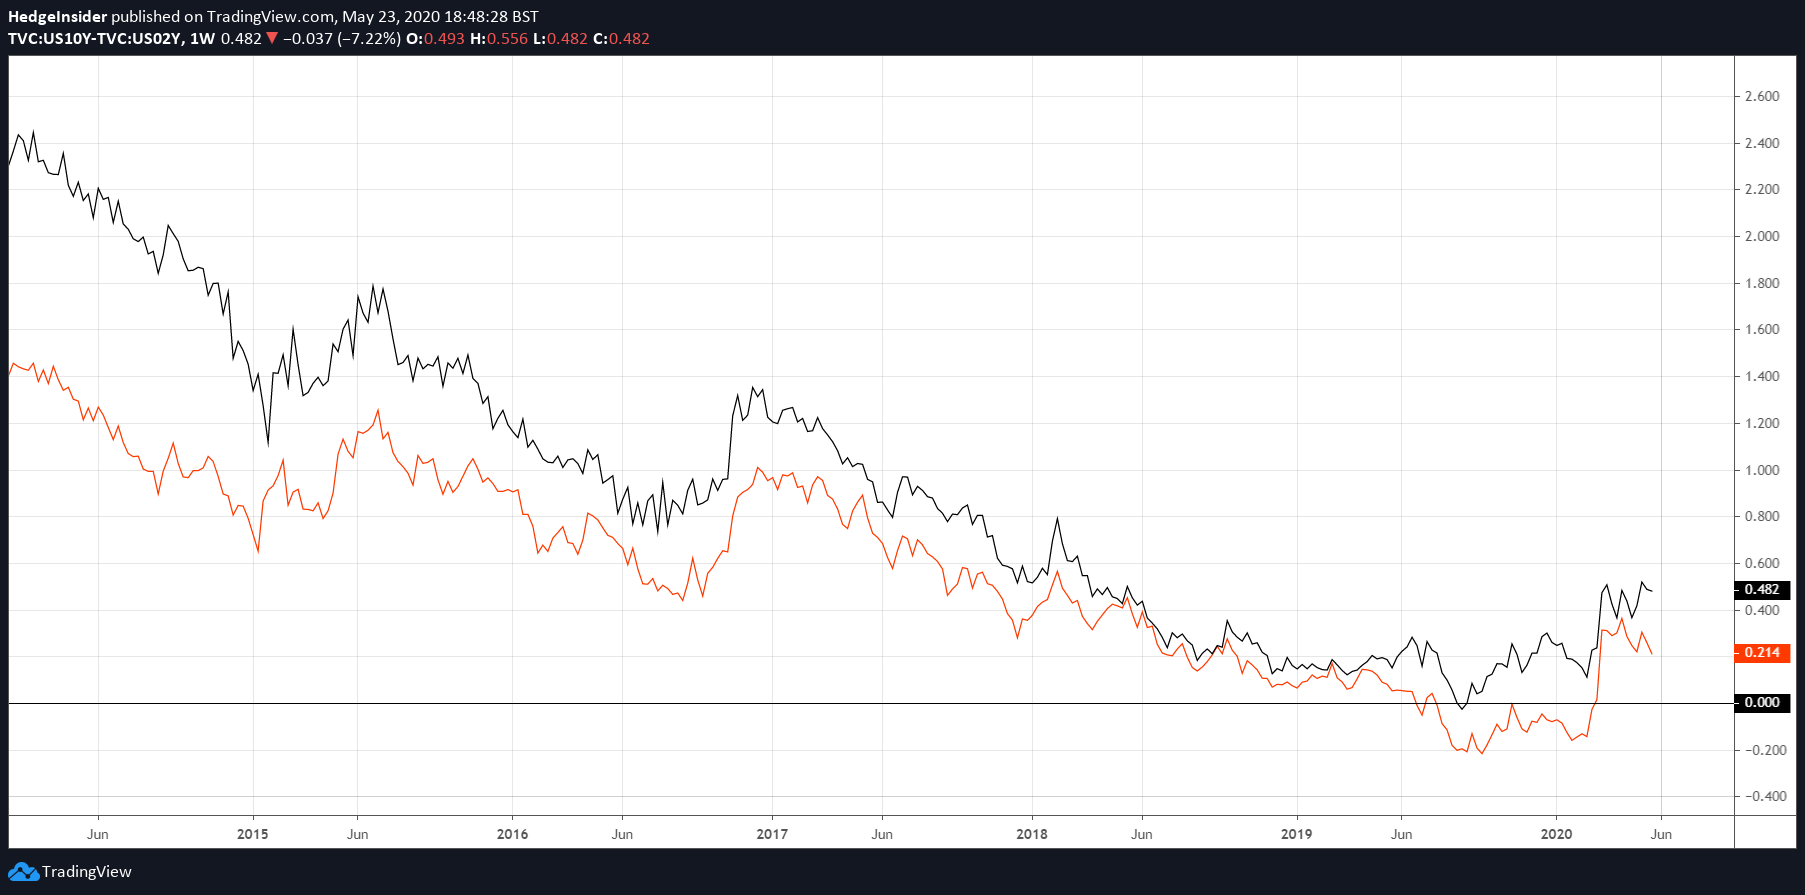 Note that the Canadian yield curve inverted during much of the second half of 2019, whereas the U.S. curve had a far shorter inversion. Both curves have steepened recently, however the Canadian yield curve is looking less healthy. An inversion is the bond market’s way of voting against an economy’s long-term prospects, implying that longer-term interest rates are unlikely to be higher than current rates (rates usually rise and fall in line with economic growth and inflation).
Given that the recent spike in USD/CAD happened to occur after a prolonged inversion of the Canadian yield curve (“under-performing” the U.S. curve consistently through the second half of 2019, and into 2020), it would be risky to short USD/CAD immediately. As alluded to earlier, there is a possibility that the pair strengthens in the near term, possibly even to take out the recent high above the 1.46 handle. Nevertheless, longer term, CAD is likely to give the oil market credit for its improving prospects. The Canadian dollar could be shaping up for a bullish run in the longer term.
Disclosure: I/we have no positions in any stocks mentioned, and no plans to initiate any positions within the next 72 hours. I wrote this article myself, and it expresses my own opinions. I am not receiving compensation for it (other than from Seeking Alpha). I have no business relationship with any company whose stock is mentioned in this article.
