
This post was originally published on this site
The search for yield is still a struggle.
The pile of debt around the world that offers a negative nominal yield — meaning that investors would effectively have to pay for the privilege of parking their money — is on the rise again.
According to the Financial Times, a Barclays index shows the amount of debt offering negative yields now stands at $16.5 trillion, a six-month high.
Earlier this week the yield on 30-year German government debt
TMBMKDE-30Y,
slipped below 0% for the first time since February and was trading Thursday at -0.051%. That means the entire German government yield curve now trades in negative territory again.
Japanese yields have also declined, with the 10-year government bond
TMBMKJP-10Y,
yield slipping back below 0% this week. Yields fall as bond prices rise. The European Central Bank and the Bank of Japan are both holding official interest rates below zero.
It’s part of a global story that saw yields rise in the early part of this year as investors bought into expectations for a reflationary surge as the world economy reopened in the wake of the COVID-19 pandemic. Inflation eats away at the stream of interest payments offered by bonds. Rising inflation worries sparked a bond selloff, which drove up yields.
More recently, inflation worries have given way to an economic growth scare, partly due to the prevalence of the delta variant of the coronavirus, which is getting some of the blame for the renewed fall in longer-term yields. In the U.S., official rates and debt yields remain nominally positive, but the 10-year rate
TMUBMUSD10Y,
has fallen sharply, trading below 1.14% — its lowest since February — on Wednesday, before bouncing back somewhat.
The moves have sparked a series of rotations in the equity market, while major averages have scored a string of record highs. The Dow Jones Industrial Average
DJIA,
is up more than 14% for the year to date, while the S&P 500
SPX,
has rallied 17.7%.
It’s no surprise to see negative global yields serving to drag U.S. yields lower.
Nicholas Colas, co-founder of DataTrek Research, pointed to the chart below in a Thursday note, observing that the trend to ever-lower sovereign debt yields started after the financial crisis of 2008. That’s not just the result of bond buying by central banks, but also to a slow recovery from the 2007-09 recession and aging demographics across much of the developed world.
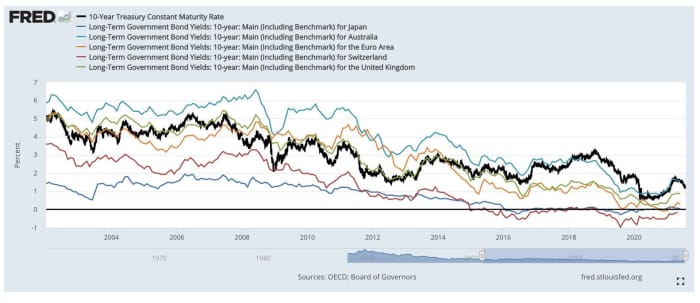
The chart above tracks the 10-year Treasury yield, the bold black line, versus the 10-year yields for Japan (light blue line), Australia (dark blue), the eurozone (orange), Switzerland (red) and the U.K. (green). Over time, the Treasury yield goes from middle of the pack to the top, Colas noted.
While there are other reasons for the retreat by the 10-year yield from its March high just shy of 1.80%, the realization the pandemic is still taking a toll on global economic growth is toward the top of the list, he said, leaving global asset allocators little choice.
Some yield “is better than nothing, so capital is flowing to Treasurys,” he said.

