
This post was originally published on this site
This article is written by Euphoric Investment authors Austin Weiermiller, Youbeen Baek and Zach Thomas.
Overview
Virtually every interaction we have as humans has been flipped on its head due to the effects of COVID-19. Popular upticks in working from home, social distancing, and limited traveling are all substantial trends that we feel. At the market lows of March 23rd, the S&P bottomed in 2020 at 2,377.44. From those lows, the S&P has since recovered over 30% in market value. A question many investors are asking is – Do the markets still have legs to run?
We fully believe that there is plenty of gas left in the market’s tank despite the sentiment around this pandemic.
The Spanish flu, 9/11, SARS, and other black swan events all have one thing in common when it comes to the market: Wall Street is resilient! Following the 11 worst performing quarters in S&P 500 history since 1990 (Q1 2020 being the worst quarter in market history), the market has shown an average return of 7% in the subsequent quarters (see figure 1 below). Airlines, banks, and oil companies have all withstood the test of time, yet the markets have priced in what it believes is the end of the road for these cyclical sectors. Legendary investor Bill Miller put it best in his interview on CNBC stating “if you are betting against airline stocks, you are in turn betting against a vaccine.”
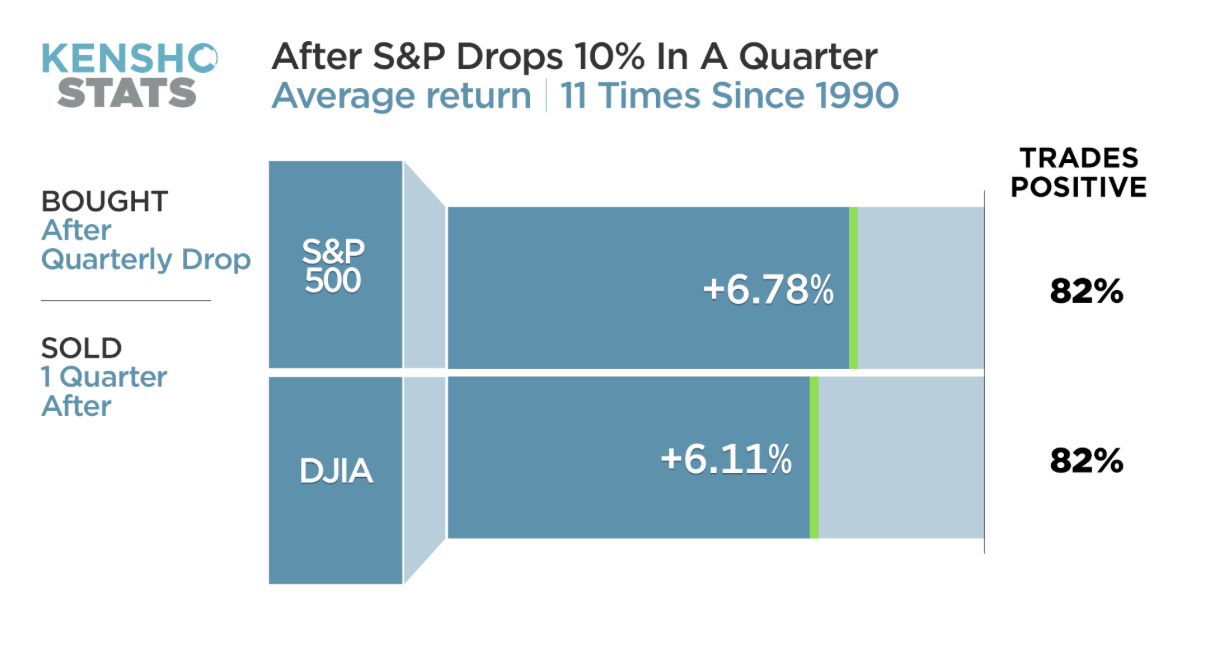
Figure 1 (Source: CNBC)
In terms of an overall strategy, our portfolio has been evenly divided into two sub-sectors that we have referred to as “More Room for Growth” companies and “Guilty by Association” stocks/indices.
We define “More Room for Growth” as companies that have benefited immensely from this COVID-19 environment, and the market has priced these stocks back to pre-COVID levels seen earlier this year. Yet, these three names we have picked have more growth ahead not only for the rest of 2020 but also in the years to come.
For our “Guilty by Association” sub-sector, we identified these industries (casinos, real estate and financials) as some of the hardest hit due to this change in consumer behavior. All three of these stocks/indices are dramatically undervalued as they have been impacted by uncontrollable circumstances. Whereas our first sub-sector highlights more room for growth, these names illustrate a comeback to previous levels that we saw in early 2020. Pent-up demand is the driving force behind this sub-sector, and we believe that these three names will show resilience not only for the rest of 2020 but also in the long term as the entire world returns to a new version of normal.
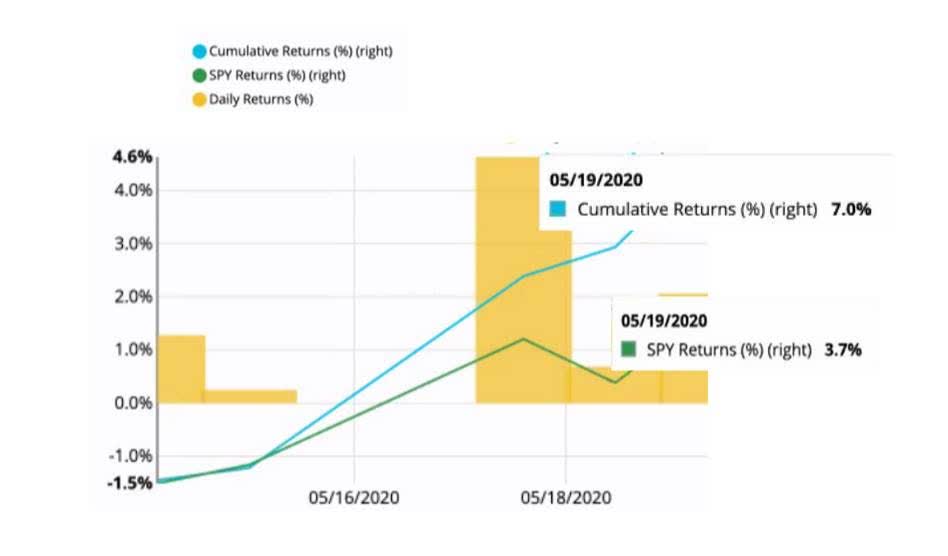
Above is a chart of our portfolio’s cumulative returns on 5/19 in comparison to the S&P’s returns on the same day.
As a result of COVID-19, the markets have been deeply entrenched by this black swan event that has so adversely impacted many Americans. Our goal is to create the most alpha through these six securities and indices despite shelter in place being a major concern of Wall Street analysts. We want to take advantage of these six investments and this is why.
“More Room for Growth” Companies
The Boston Beer Company, Inc. (SAM):
-
Sales increased 36% in Q1 2020 (YoY).
-
The company has increased advertising/marketing capex in efforts to increase consumer demand for the upcoming Summer season peak.
-
An increase in sales (up to 20%) in 2020 is expected as the company has resolved supply chain issues.
As COVID-19 has limited our ability to continue our normal daily lives, many have experienced an abundance of leisure time. From that, alcohol sales have increased by 55 percent within the United States. The Boston Beer Company, also known as the founding company of various alcoholic beverages including Samuel Adams, is one of the most popular brands in the industry.
In early 2016, Samuel Adams released a new and unique line of low-calorie, light tasting beer – Truly Hard Seltzer. With the private company White Claw pioneering the recent hard seltzer trend, Boston Beer Company decided to launch its brand Truly, as the second player in this market space. Since then, Truly has returned Boston Beer to its growth days of 2012 to 2015. Boston Beer is exhibiting record sales and growth due to the popularity of Truly. From its most recent 10-Q, CFO Bill Urich stated that “Depletions increased 36% from the comparable 13-week period in the prior year” due to the popularity of Truly Hard Seltzer in the last 12 months.
During 2017 and 2018, the company faced supply chain issues as the demand for Truly seltzer rose. Specifically, the sleek can manufacturing companies could not keep up with the increased demand. Since then, the Boston Beer Company has fixed its production problems and increased its depletions/shipping by 36 percent Q1, which will contribute to the possibility of increasing its overall growth by 15 to 25 percent in 2020 sales.
In order to compete with others in the hard seltzer industry, the Boston Beer Company has increased Advertising, promotional, and selling expenses by $26.2 million (total of $97.9 million) compared to Q1 2019 ($71.7 million). By doing so, the company expects to increase sales during its peak season and make its line of Truly the ultimate Summer season hard seltzer. According to calculations based on the 10-K reports of 2019, a dollar spent in marketing equates to a profit of 3.704 (marketing ROI of 1:3.704).
Overall, the alcohol industry is undeniably growing because of stay-at-home orders and the Boston Beer Company is leading the way. The recent overall preference of hard seltzers and the success of Truly will grow beyond measures in the future. Every year since its launch in 2016, Truly has claimed a market share of about 30 percent in the industry. Coming in second behind White Claw, Truly has managed to stay as one of the top hard seltzer brands despite manufacturing issues and competition from other alike substitutes.
Fortinet, Inc. (FTNT):
-
Fortinet has had a growth in operating income of 56% YoY.
-
FTNT expects its revenue to be in the range of 590M to 605M in Q2 of 2020, which would be an increase in revenue of 2.27% to 4.87% from Q1 to Q2.
-
Fortinet has seen a 17% increase in viruses and cyber attacks in January, a 52% increase in February, and a massive 131% increase in March compared to the same months in 2019.

Source: Check Point Research highlights the parabolic increase in relation to COVID-19 shelter-in-place legislation.
Due to the current stay-at-home orders issued in virtually every corner of the world, people have resorted to communicating via platforms like Zoom and Skype. In addition, computer usage has increased as billions now work at home. This has opened up a whole new world for cybercriminals to take advantage of the sudden surge in computer usage, and these hackers are here to stay.
Fortinet has stated that it has seen a drastic increase in cyber attacks in the past 3-4 months. Fortinet claims that in Q1 2020, it has seen a 17% increase in viruses and phishing attacks in January, a 52% increase in February, and a 131% increase in March, in comparison to the respective months in 2019. This means that as more people become exposed to these cyberattacks, they are going to look to companies to protect their information and intellectual property. The question becomes this: which cybersecurity company will be in the best position to take advantage of this paradigm shift in demand?
We believe that Fortinet is the company that will benefit and capitalize the most from the unprecedented need for cybersecurity. Fortinet has posted a growth in operating income of 56% YoY. Fortinet is also issuing guidance in its Q2 income growth to be in the range of 2.27% to 4.87%. The crossover between the shelter-in-place legislation and the current 2020 election year underlines the need for cybersecurity and emphasizes the importance of cyber-related protection. The current state of our unique environment highlights the potential growth that could be enabled by adding cybersecurity based security into an investor’s portfolio, and our group’s research states that Fortinet is undeniably the top pick.
Match Group, Inc. (MTCH):
-
ARPU (Average Revenue Per User) is up to an average of .59 cents.
-
Average subscribers for Match Group have increased 15% YoY to 9.9 million users.
-
The stock price is still 18% off its 52 wk. high.
The Match Group is arguably one of the biggest players when it comes to online dating. Shelter-in-place legislation, while it is highly dependent on the state, has forced people to turn to this platform as an outlet for finding a significant other. While many believe that the market has already priced in this company’s growth potential to future users, we feel as if its financials tell a drastically different narrative.
The Match Group has been undoubtedly dominating the online dating market by showing an increase in ARPU (1% overall with a 5% increase in the US) as well as the number of average subscribers (15%) YoY. As a result, the company’s Q1 earnings report highlights a diluted EPS increase by a staggering 31%. This directly correlates to Match Group’s performance from a revenue and net income standpoint. We see no roadblocks or barriers as to why these numbers would come to a halt in the near or long term, making this company a true beneficiary to this atmosphere that COVID-19 has created.

Source: The Match Group, Inc. Q1 2020 Earnings Report showing key metrics such as APRU increases and total average subscribers increases.
As far as the bigger picture is concerned, TTM revenues of $2.13 billion paired with revenue growth just shy of 20% illuminate why this company is a noteworthy investment. Combined with ARPU and average subscriber gains, this company is poised to continue growing at an unprecedented rate. We see no reason prohibiting this company from revisiting its 52 wk. high of $95.32 that it had previously reached on January 13th before the COVID outbreak in the United States and visiting newfound stock prices that this market has never experienced.
“Guilty By Association” Companies/Indices
Wynn Resorts, Limited (WYNN):
-
International revenue in Macau shrank from 76% in Q1 2019 to 50% in Q1 2020.
-
Macau is poised for a quicker restart than the US as China was impacted by COVID-19 in late 2019.
-
Estimated tourist arrivals in Macau are expected to increase from 140,000 by the end of Q2 2020 to 3,162,000 in 12 months’ time, a 2,158% increase.
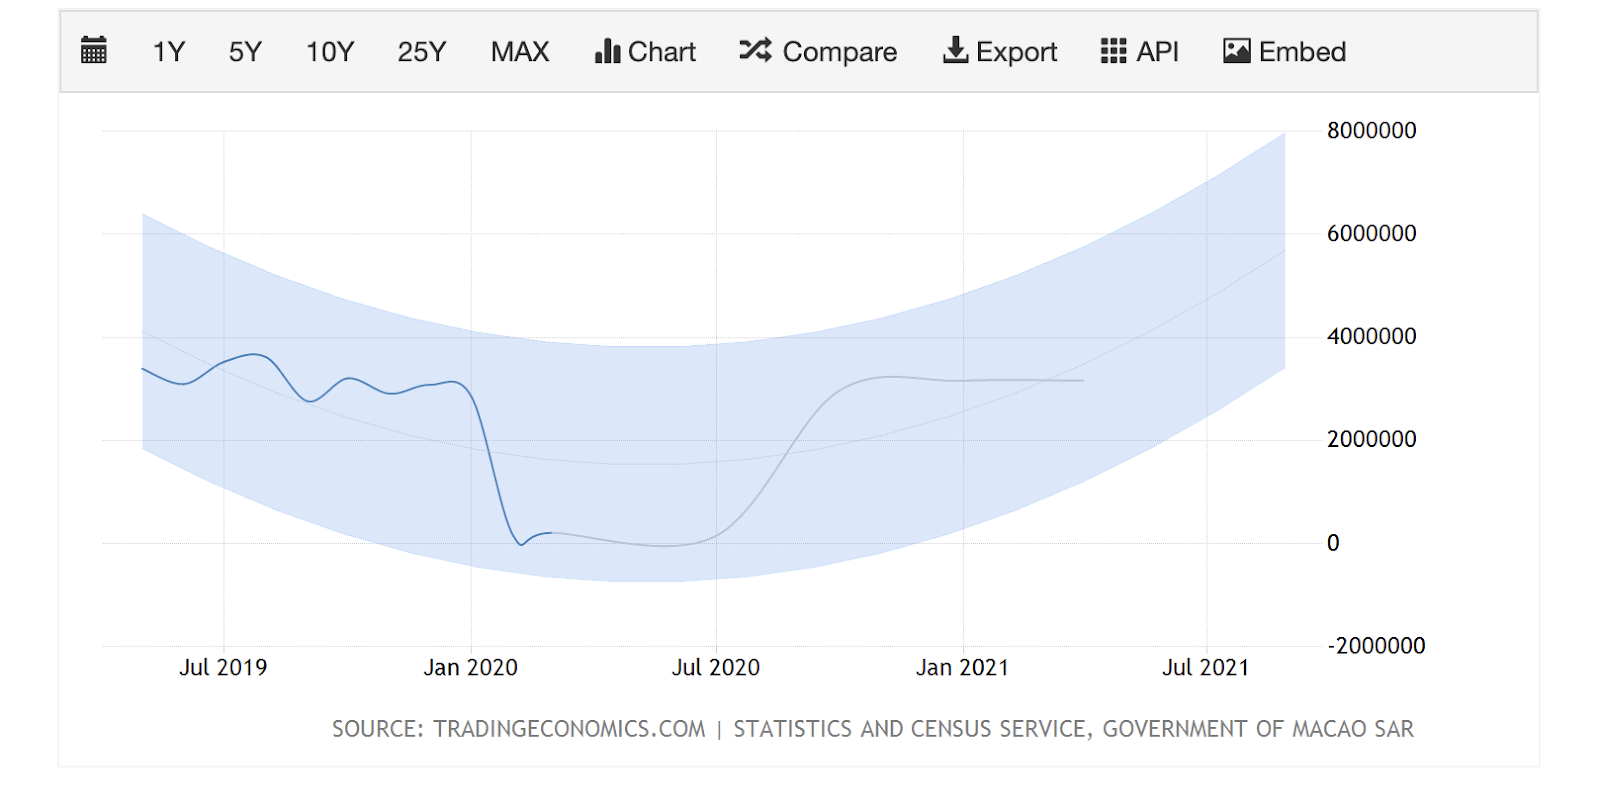
Source: Trading Economics highlights how tourists in Macau will eventually surpass normal levels.
When Americans think of casinos, they think of the gambling capital of the United States: Las Vegas. While large casino companies have exposure in Vegas, copious amounts of revenue stem from a completely different beast: Macau. Gambling revenue in 2019 from Macau reached $36.5 billion whereas Vegas gambling revenue in 2019 came out to roughly $6.59 billion.
Wynn Resorts stands to benefit the most from this global pandemic environment. This company only has two properties in Macau compared to five properties that competitor Las Vegas Sands (LVS) owns, yet Wynn makes significantly more revenue per casino in Macau than LVS does ($244.5 million in Q1 2020 compared to LVS’s $162.8 million). When Macau’s tourist arrivals stimulate to levels that we have seen in the past, Wynn will ultimately be the lead beneficiary.
Second, Wynn’s COVID-19 response, which is encapsulated in a 28-page lengthy document, is now being adopted by rival casinos everywhere. Being the first casino to close its doors in the US, Wynn appears to be in the lead yet again in terms of reopening. Social distancing guidelines, taking every guest’s temperature, and even changing floor plans to accommodate this new environment is in the works for all Wynn properties.
Since Macau’s casinos officially opened their doors for business on February 20th, the stock’s price has been down 40%. The stock has ample room to grow as Macau, Las Vegas and now a new property in Boston see guest numbers return to normal in the near future.
iShares Mortgage Real Estate Capped ETF (REM):
-
This ETF is down 58% from its 52 wk. high.
-
Mortgage rates have reached an all-time low.
-
We are forecasting a full recovery in the next 12 months with a surge in demand for new home buyers.
The symbol REM represents and tracks the Mortgage Capped Index which is composed of the US Real Estate Investment Trusts (REITs). The underlying index measures and tracks the performance of residential as well as commercial real estate markets.
Investing in this ETF gives this portfolio direct exposure to the domestic real estate markets, and REM is down 58% from its 52-week high and 52% YTD. The 30-year mortgage rate has reached 3.26% this month, an unprecedented decrease of 26% YTD that this market has never seen. Shifts in consumer behavior have been noteworthy as the United States’ new home sales have depleted 15.38% from February 2020 to March 2020. Yet, the consistent theme of this half of our portfolio is how COVID-19 will ultimately boost certain sectors in the future that haven’t reaped the certain momentum swings of other beneficiaries.
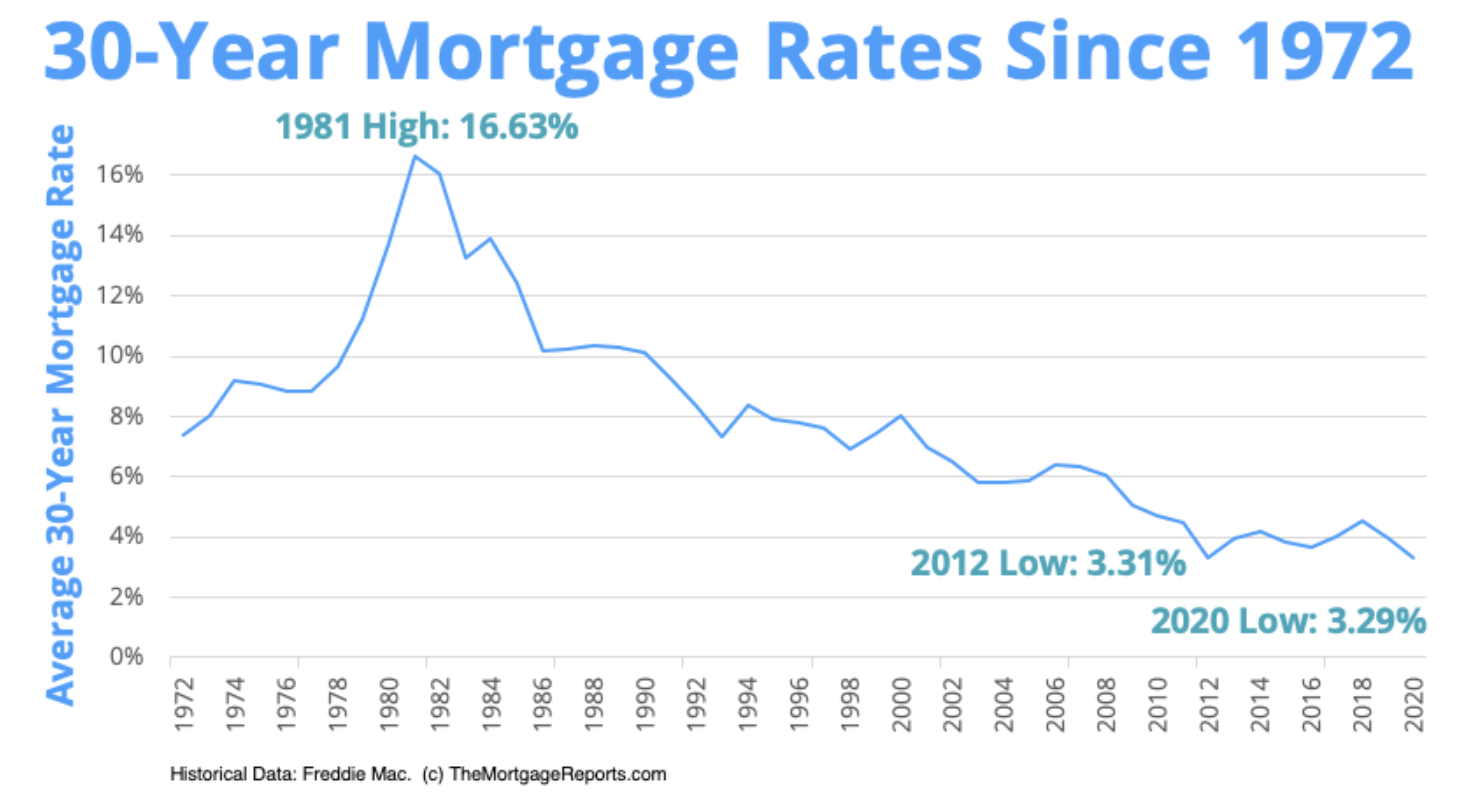
Source: The Mortgage Reports emphasizes how low the current mortgage rates are in comparison to recent years.
If anything, this virus has nudged America towards a world where cities are not at a high premium to live in. Working from home can now be done from the comfort of your own living room, not the high rise office that is a 45 minute commute (without traffic presumably). Densely populated cities such as New York have become a petri dish for the coronavirus and future diseases to take effect.
These low mortgage rates combined with the index 52% off its January 2nd price, as well as a sentiment shift in home buyers moving from cities to suburbs, lead us to expect the index to make a full recovery in 12 months time.
Citigroup Inc. (C):
-
C is currently trading at a .55X price/book ratio.
-
Citigroup’s book value per share has the highest disparity amongst the four biggest banks.
-
This bank has the highest TTM revenue growth out of its competition.
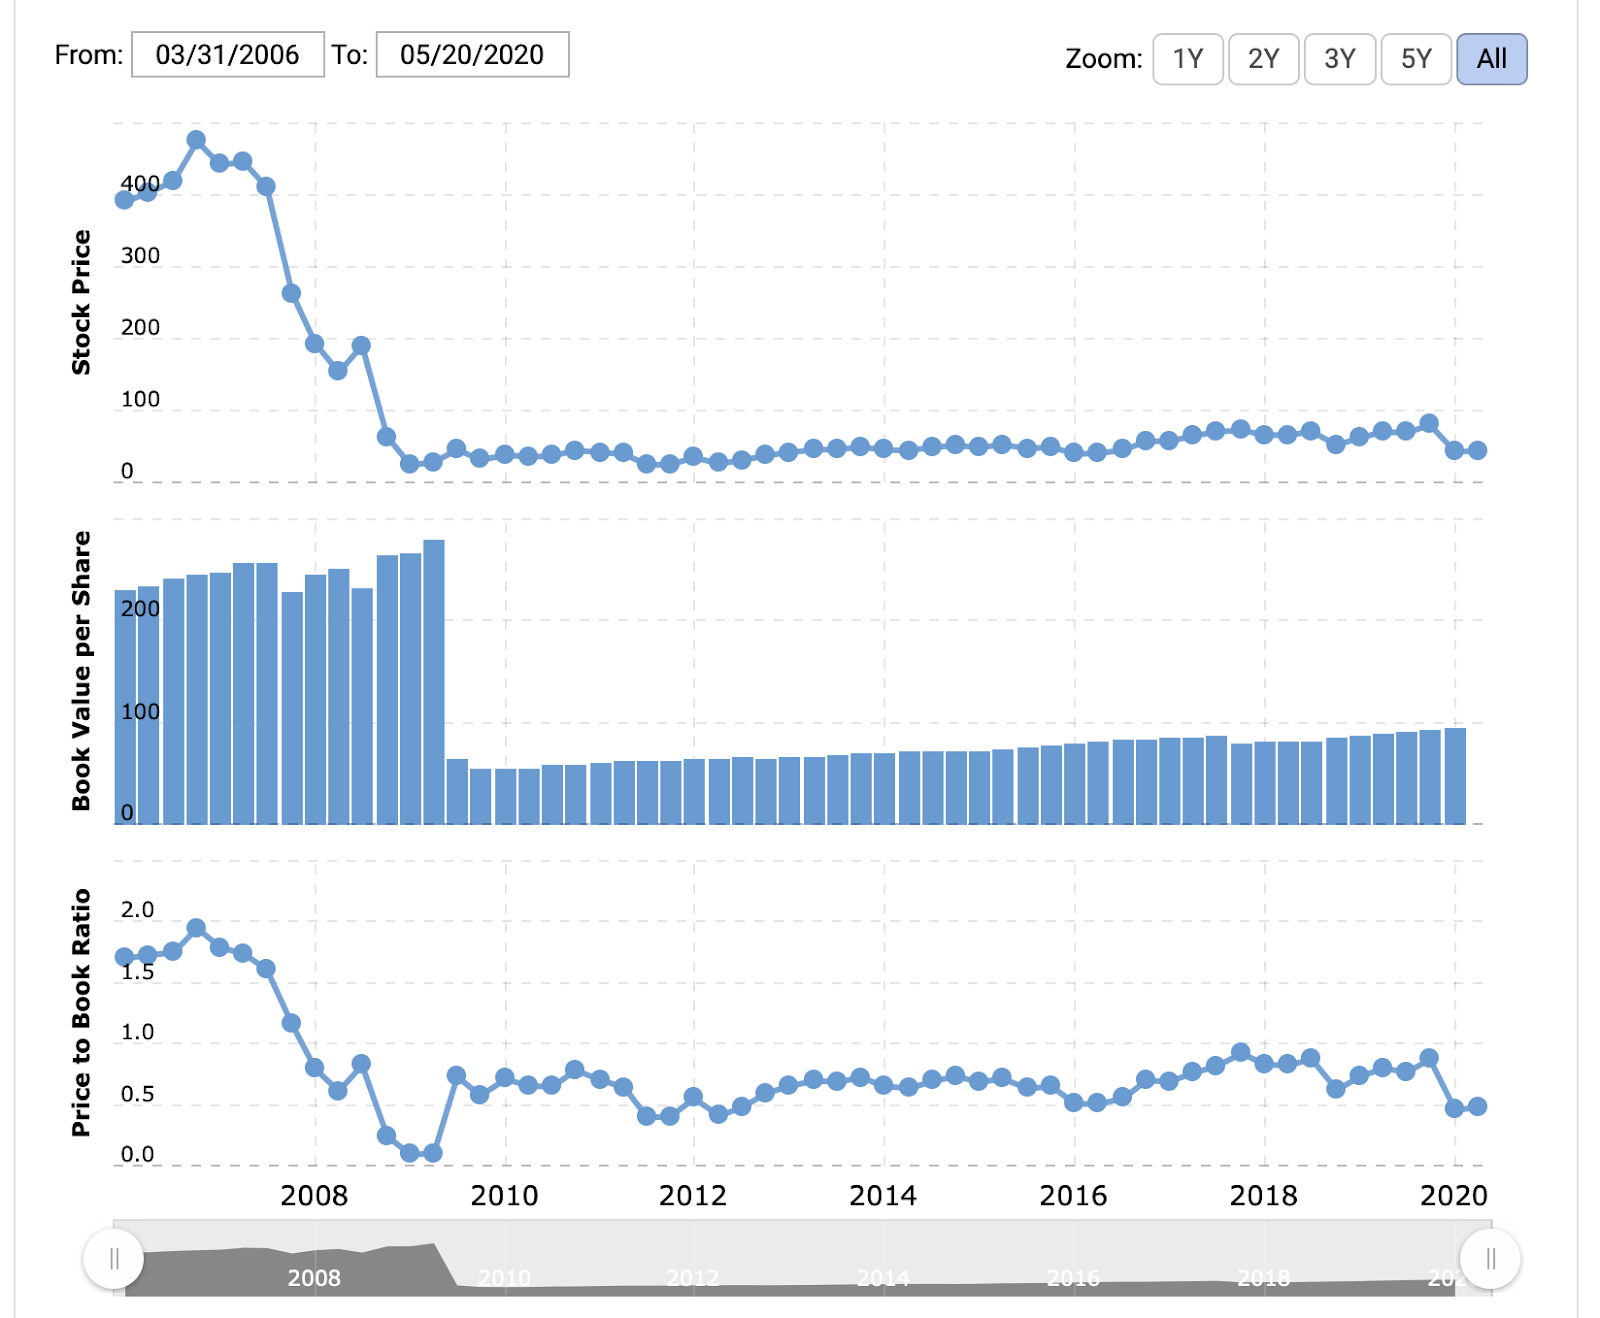
Source: Macrotrends graph above illustrates book price, book value per share, and price to book ratio of Citigroup Inc.
Financial companies have been one of the hardest hit industries by the COVID-19 pandemic. Yet, we expect Citigroup’s revenues and net income statements to tell a different story that would not suggest a 50% selloff in this sector. C gives investors the most upside in the financial industry in terms of growth for various reasons consisting of revenue growth, price/book ratio, and book value per share.
The big banks we are looking at are JPMorgan (NYSE:JPM), Bank of America (NYSE:BAC), Citigroup, and Wells Fargo (NYSE:WFC) (four biggest banks by market cap). When we compare all four of these companies in terms of revenue growth TTM, the bank that stands out amongst the rest is C, with revenue growth coming in at -2% which far outweighs its opposition. Yes, we are celebrating negative revenue growth.
The other metric that is key when it came to our analysis of choosing Citigroup amongst the bank sector was the price/book ratio. C is currently trading at an astounding .55X price/book, the lowest ratio by a considerable amount compared to the four biggest banks.
As a result, this transitioned into our last statistic which led us to arrive at our conclusion of holding equity in Citigroup: the book value per share. This measurement allows us to dive deeply in regards to overvaluation or undervaluation of a company’s stock price. Citigroup’s book value per share has undoubtedly the highest disparity amongst its actual real-time stock price which led us to believe that this bank is the most undervalued amongst all of its competitors. Citigroup’s book value per share is currently at $71.52 while its stock price is trading slightly over $45.
Wrap-Up
As exhibited in the article above, we have emphasized the impact of our portfolio research by citing the incremental difference between our security collection versus the actual S&P rate. In light of our presentation, we hope that investors and readers consider our recommendations, see the value, take note of the potential growth, and include the companies listed above to their own portfolio during this season in order to positively impact their investments choices. Our group emphasizes the high worth of the companies listed above, and we hope that investors find light during this uncertain season by investing in what we believe is the ultimate portfolio.
This is our blueprint for how to generate the most alpha in relation to the S&P 500. In our articles to come, we will show how more alpha can be generated by looking at specific sectors that can be heavily disrupted due to recent events.
Disclosure: I/we have no positions in any stocks mentioned, and no plans to initiate any positions within the next 72 hours. I wrote this article myself, and it expresses my own opinions. I am not receiving compensation for it (other than from Seeking Alpha). I have no business relationship with any company whose stock is mentioned in this article.
