
This post was originally published on this site
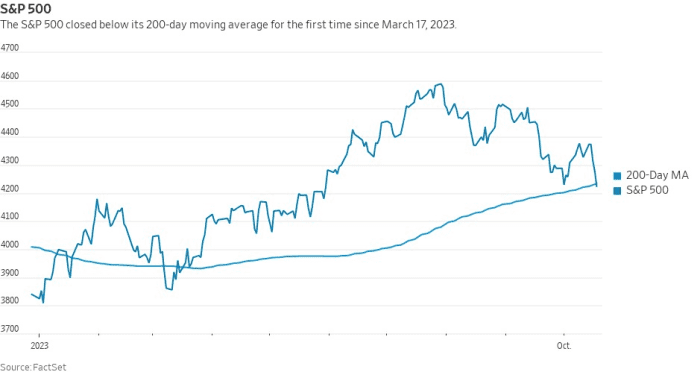
The S&P 500 index capped off a busy week for U.S. markets on Friday by breaking below its 200-day moving average for the first time in more than six months. It also erased the last of its gains from a summer advance that peaked in late July.
The index
SPX
fell 53.84 points, or 1.26%, on Friday to finish the week at 4,224.16 after falling for a fourth straight day, marking the lowest closing level for the index since June 1, and also the first close below its 200-day moving average — which stood at 4,233.17 — since March 17. The S&P 500 fell 2.4% this week, its worst week in a month, and has now finished lower during five of the past seven weeks.
DOW JONES
The index has fallen 6.8% from its July 31 closing high, FactSet data show but remains up 10% year to date.
Although a break below the moving average is usually seen as a bearish signal, other indicators suggest that the S&P 500 has fallen into oversold territory which could portend a fresh turn higher beginning as soon as next week, technical analysts said.
“From my perspective, this market has gotten to be pretty oversold,” said Craig Johnson, chief market technician at Piper Sandler, during a phone interview with MarketWatch.
A proprietary Piper Sandler database of all U.S. traded stocks with a market capitalization greater than $25 million and a share price above $2 showed that just 18% of stocks were trading above a 40-week moving average, a level that’s only been reached 10 times since 1987, Johnson said. Often, when so many stocks are trading at such low levels relative to their recent performance, it signals that a turnaround could be near.
“It’s really rare to see readings this low,” Johnson added.
Furthermore, more than 65% of S&P 500 stocks were trading below their 200-day moving average as of Friday’s close, the highest reading in a year, FactSet data show. All of this is consistent with what Johnson and others have described as a “washout” for stocks.
Back in March, when the index last closed below its 200-day moving average, it only remained below it for six sessions. Dow Jones data showed that the S&P 500 closed below its 200-day moving average for five straight days from March 9 to March 15, then closed below the average again for a single day on March 17.


