
This post was originally published on this site
Stock market timers have turned so bearish in recent days that a contrarian buy signal could be close.
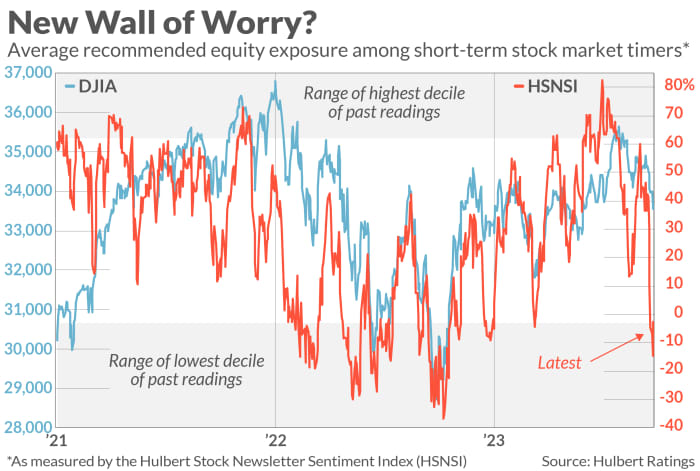
Consider the average recommended U.S. equity exposure level among a subset of several dozen stock market timers my firm monitors on a daily basis. This average recently dropped into the range of readings I consider to be the zone of excessive bearishness — in the bottom 10% of the historical distribution since 2000. From a contrarian point of view, of course, excessive bearishness is a bullish indicator.
The current sentiment situation is at the opposite extreme of what prevailed two months ago, in mid-July. That was when the U.S. stock market was surging to new bull-market highs, and the market timers were bordering on irrational exuberance. I wrote then that, because the stock market has “no wall of worry left to climb,” it was not a good time “to put more money into stocks.”
With the S&P 500
SPX
more than five percent lower today than when that column was published, the sentiment picture has changed dramatically — as you can see from the chart below.
Note that contrarian analysis can’t claim to pinpoint the exact day of the bottom, even when it works out. My July column, for example, came a couple of weeks before the day of the bull market high. Those who took the occasion of that column to lighten up on stocks missed out on an additional two percent rise in the S&P 500
SPX.
“ Sentiment data suggests that the bottom for this correction is close. ”
Something similar could happen now, with the stock market continuing to fall for several more days before the correction hits its bottom. But the sentiment data suggests we’re getting close.
Another implication of recent sentiment developments is that the current correction is unlikely to be the beginning of a new bear market. That’s because bear market beginnings are typically met by a stubborn refusal of the bulls to turn bearish. That’s not what we’re seeing now.
From its highest level in July to its recent low, in fact, the market timers’ average equity exposure level fell 92.9 percentage points. Drops as big as this in as short a period of time are more typical of bull market corrections than the start of a new bear market.
Mark Hulbert is a regular contributor to MarketWatch. His Hulbert Ratings tracks investment newsletters that pay a flat fee to be audited. He can be reached at mark@hulbertratings.com
Also see: Stocks are stuck in the breakdown lane and repairs will take time

