
This post was originally published on this site
“ On the positive side, the market is quite oversold. ”
The stock market, as measured by the S&P 500 Index
SPX,
has broken out of its trading range to the downside. The close below 4330 was the catalyst, as we have been saying it would be.
The next support level is at 4220, but this breakdown establishes a downtrend on the SPX chart. That is, there is now a pattern of lower highs and lower lows, and that is the definition of a downtrend (red lines on the accompanying SPX chart). This is thus more than a mere correction in the bull market, and it could last for a while.
On the positive side, the market is quite oversold. Oversold rallies can often carry back up to the declining 20-day moving average, at which point they fail. That moving average is currently at 4430 and beginning to fall rapidly.
Furthermore, October is known as the “bear killer” month. Yes, I know that the stock market has sometimes had some nasty downturns in October, but eventually the market typically bottoms in that month and rises thereafter. We are probably in the process of seeing that happen again, but we’d need to see confirmed signals before trading on that information.
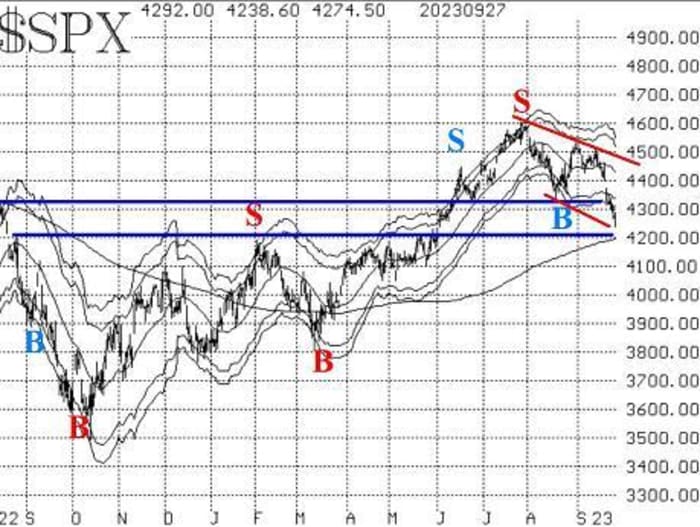
Finally, the 200-day Moving Average of SPX is now approaching that same 4200 level, so that might add further support.
This latest move by SPX has seen it close below the -4σ “modified Bollinger Band” (mBB). That stops out the previous McMillan Volatility Band (MVB) buy signal from mid-August. A new sequence of volatility band-based signals now needs to set up (begin) again. First, a “classic” mBB buy signal will occur when SPX closes above its -3σ Band. That would occur today on a close above 4326. However, we do not trade the “classic” signals, preferring rather to wait for the further confirmation of an MVB buy signal, which is not guaranteed to occur.
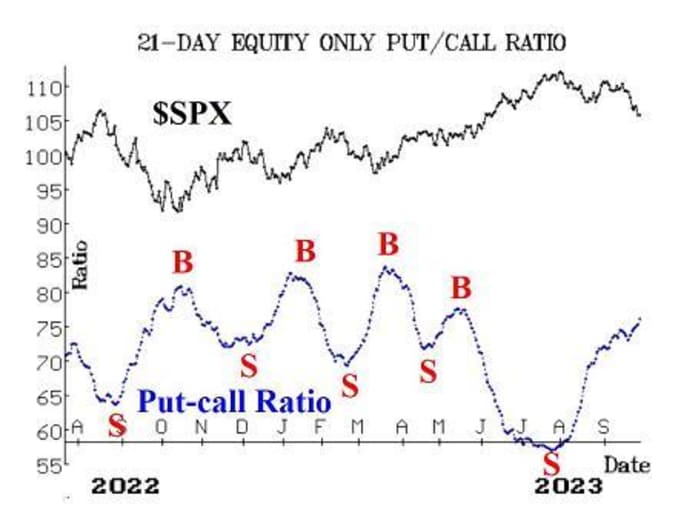
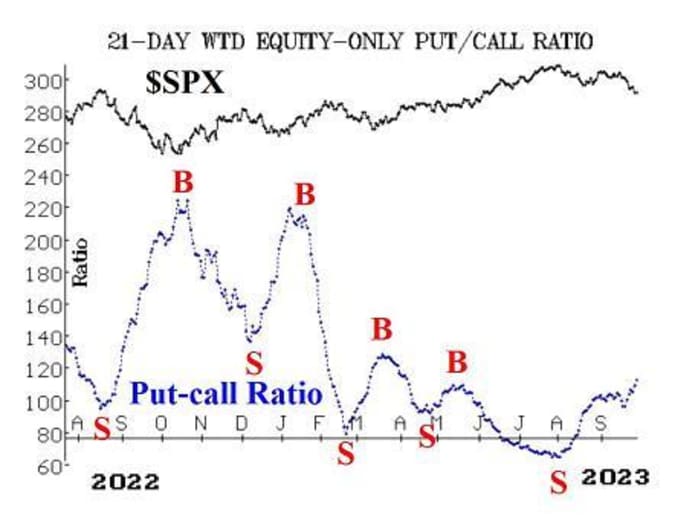
Equity-only put-call ratios had been flirting with potential buy signals a little over a week ago. Those buy signals did not materialize, and now the ratios are moving swiftly higher — making new relative highs for this upward move that began in late July. That is bearish for stocks and will continue to be until the ratios roll over and begin to trend downward.
Market breadth has been terrible, and both breadth oscillators remain on sell signals, albeit in deeply oversold territory. It’s going to take at least two and probably three days of positive breadth just to roll these oscillators over to buy signals.
The number of New 52-week Lows on the NYSE is dominating New Highs. There have been a few days with over 200 issues making new lows, and one day with 300 issues doing so. This indicator gave a well-timed sell signal a little over a week ago, and that sell signal remains in place now. It would be stopped out if New Highs on the NYSE were to outnumber New Lows for two consecutive days.
Even the volatility complex is showing some modest signs of bearishness. The volatility “space” has been quite bullish all along, and even now I wouldn’t say it’s rampantly bearish.
First, VIX
VX00,
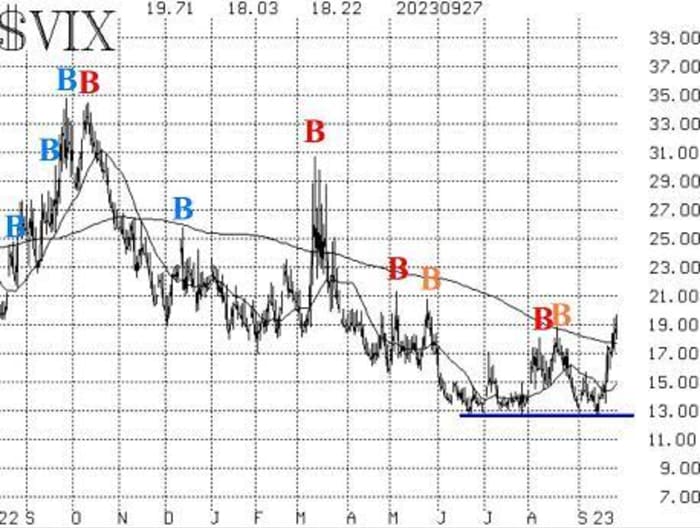
is in “spiking” mode and has been for a week. The stock market can fall sharply while VIX is in “spiking” mode, as you are seeing for yourselves this week. Eventually, though, a VIX “spike peak” buy signal will take place when VIX closes at least three points below the highest price that it reached while in this most recent “spiking” mode. So far, that high price is 19.71, the high of September 27th. So, if that were to remain the high, then a VIX close below 16.71 would generate the buy signal.
Moreover, the trend of VIX buy signal that began in November 2022 has been stopped out since VIX has closed above its declining 200-day Moving Average. However, a trend of VIX sell signal will not take place unless both VIX and its 20-day Moving Average are above the 200-day MA. Since the 20-day MA is well-below the 200-day MA at this time, that type of sell signal is not imminent.
The construct of volatility derivatives has gotten far less bullish, but it has not generated a sell signal yet. The term structure of the VIX futures has flattened a lot, but the front-month October VIX futures have not risen in price above the November VIX futures. If they do, that would be a very bearish sign. The CBOE Volatility Index term structure also slopes upward, with the exception of the 9-day Index (VIX9D), which is elevated because of the upcoming Unemployment Report. That report will take place next Friday – thus within the nine-day “window” that this index encompasses.
With the market having broken down, a “core” bearish position is justified. Around that, we will trade other confirmed signals if and when they occur.
New recommendation: Potential VIX ‘spike peak’ buy signal
As noted, with VIX
VIX
in “spiking” mode, a VIX “spike peak” buy signal will eventually occur. Specifically, it will take place when VIX closes at least three points below the highest price it reached while in this most recent “spiking” mode. So far that high is 19.71, but you should keep track of VIX to see if it goes higher than that before eventually retreating.
IF VIX closes at least three points below the highest price that it has reached from September 27th going forward (currently 19.71), then buy 1 VIX Nov (17th) at-the-money call and Sell 1 VIX Nov (17th) call with a striking price 15 points higher.
This signal, if completed, will last for 22 trading days. It would be stopped out by a VIX close higher than the high point that triggered the recommendation.
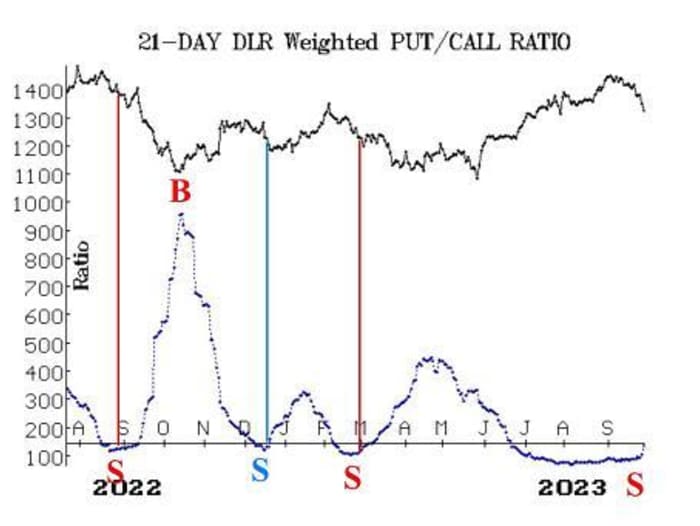
New recommendation: Digital Realty Trust (DLR) puts
DLR
DLR,
has broken its uptrend line at the same time that a new put-call ratio sell signal was established. Therefore we are going to buy a small bearish position.
Buy 2 DLR Nov (10th) 118 puts in line with the market.
DLR: 117.59 Nov (10th) 118 put: 5.00 bid, offered at 5.40
We will hold these puts as long as the DLR weighted put-call ratio is on a sell signal.
Follow-up action:
All stops are mental closing stops unless otherwise noted.
We are using a “standard” rolling procedure for our SPY spreads: in any vertical bull or bear spread, if the underlying hits the short strike, then roll the entire spread. That would be roll up in the case of a call bull spread, or roll down in the case of a bear put spread. Stay in the same expiration and keep the distance between the strikes the same unless otherwise instructed.
Long 8 CRON
CRON,
Oct (20th) 2 calls: Option volume continues to be very strong. Hold without a stop.
Long 2 EW
EW,
Oct (20th) 75 puts: Roll down to the Oct (20th) 70 puts.
Long 4 expiring SPY
SPY
Sept (29th) 480 calls: This is the position taken in line with the CVB buy signal, which failed badly. These will expire worthless.
Long 1 SPY Oct (20th) 448 put: Was bought in line with the equity-only put-call ratio sell signals. Roll down to the Oct (20th) at-the-money put. We are going to hold this put until the weighted ratio rolls over to a buy.
Long 2 EQR
EQR,
Oct (20th) 65 puts: Roll down to the Oct (20th) 60 puts. We will continue to hold as long as the weighted put-call ratio for EQR remains on a sell signal.
Long 3 X
X,
Oct (13th) 31 calls: Hold without a stop while takeover offers are sort out.
Long 2 PSX
PSX,
Oct (13th) 123 calls: There has not been any specific news here, but the stock has roared ahead. The stop remains at 118 for these calls.
Long 1 SPY Oct (20th) 446 call and Short 1 SPY Oct (20th) 464 call: This spread was bought in line with the MVB buy signal of August 29th. Since SPX closed below its -4σ Band, this position should be closed.
Long 3 ADM
ADM,
Oct (20th) 82.5 puts: Roll down to the Oct (20th) 76 puts. Hold this position as long as the weighted put-call ratio for ADM is on a sell signal.
Long 5 TSHA
TSHA,
Oct (20th) 2.5 calls: The stop remains at 2.75.
Long 0 BKR
BKR,
Oct (20th) 37 calls: These calls were sold on September 21sth, when BKR closed below the trailing stop at 35.80.
Long 10 TEVA
TEVA,
Oct (20th) 10 calls: Stop out on a close below 9.75.
Long 1 SPY Oct (20th) 434 put and Short 1 SPY Oct (20th) 414 put: Was established in line with the “New Highs vs. New Lows” sell signal. Stop out if New Highs outnumber New Lows on the NYSE for two consecutive days. Meanwhile, roll both sides of this spread down so that the top strike is at-the-money. For example, if SPY is trading at 426, then roll both strikes down 8 points (434 minus 426).
Long 3 CHEF
CHEF,
Nov (17th) 25 puts: Lower the trailing stop is to 25.10.
All stops are mental closing stops unless otherwise noted.
Send questions to: lmcmillan@optionstrategist.com.
Lawrence G. McMillan is president of McMillan Analysis, a registered investment and commodity trading advisor. McMillan may hold positions in securities recommended in this report, both personally and in client accounts. He is an experienced trader and money manager and is the author of the best-selling book, Options as a Strategic Investment. www.optionstrategist.com
©McMillan Analysis Corporation is registered with the SEC as an investment advisor and with the CFTC as a commodity trading advisor. The information in this newsletter has been carefully compiled from sources believed to be reliable, but accuracy and completeness are not guaranteed. The officers or directors of McMillan Analysis Corporation, or accounts managed by such persons may have positions in the securities recommended in the advisory.
More: U.S. stocks may see volatility Friday as billions in quarterly options set to expire
Also read: Why stocks are likely to be especially volatile this October

