
This post was originally published on this site
The S&P 500’s breaking below its 50-day moving average last Friday is not a good reason to sell. In fact, the S&P 500
SPX,
over the past four decades has performed better than average when the market was below its trailing-50-day average.
There’s no way of knowing how much of Monday’s stock market plunge was caused by knee-jerk technicians who decided to build up cash because of Friday’s action. But that undoubtedly played a role. Barron’s referred to the breaking of the 50-day moving average as “scarier than tapering, taxes, and China Evergrande Group combined.”
My review of U.S. stock market history fails to find statistical support for this doomsday scenario, as you can see from the summary data in the accompanying chart. It shows the stock market’s average performance over the subsequent month-, quarter-, six months-, and year depending on whether the S&P 500 was trading above or below its 50-day moving average. Notice that the returns were slightly better following days when the S&P 500 was below its moving average — not above.
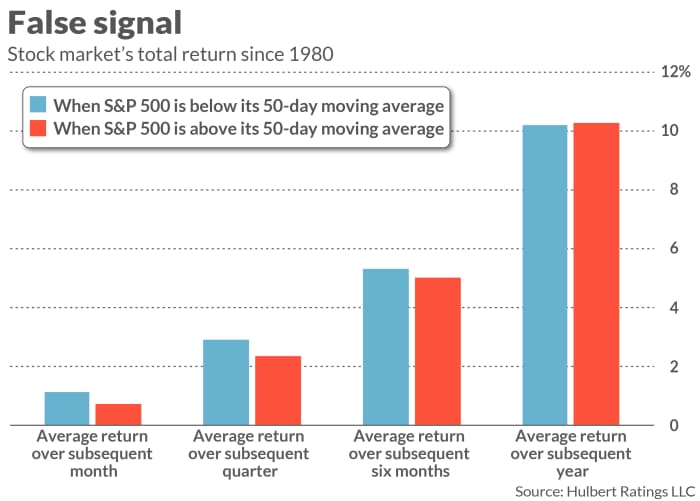
That’s just the opposite of the widespread narrative that Monday’s plunge was triggered by the market violating its 50-day average.
I hasten to add that you should not conclude that, because the S&P 500 is now below its 50-day moving average, you should become more bullish. The differences plotted in the chart are not significant at the 95% confidence level that statisticians often use when determining if a pattern is genuine.
The investment implication you should instead draw from the chart is that you’re on dangerous ground basing any projections about the stock market’s future on where the market stands relative to its 50-day moving average.
It should be obvious, but I’ll remind you of it anyway: The stock market may still decline in coming weeks. MarketWatch outlined seven other possible causes of such a decline, and I can add one more: unfavorable sentiment. The broader point of this analysis is that, if the stock market does decline, don’t blame it on the S&P 500 breaking below its 50-day moving average.
Pre-1980 experience
I chose 1980 as the data cutoff for this column’s analysis, since it was only in the 1980s that index funds started to become widely available and it became relatively easy for investors to buy or sell the entire market with a single transaction. That’s crucial to keep in mind, since the 50-day moving average did have a somewhat better record prior to 1980. But there would have been no easy way to actually follow its signals without incurring substantial transaction costs. My research suggests that, for the 20th century prior to 1980, a simple 50-day moving average trading system would not have beaten a simple buy-and-hold strategy after transaction costs are taken into account.
Blake LeBaron, a finance professor at Brandeis University, told me that he suspects it’s not an accident that moving-average trading systems stopped working at more or less the same moment that it became easier and cheaper to trade into and out of the stock market. It is a hallmark of market efficiency that previously successful strategies stop working when too many investors begin to follow them.
Mark Hulbert is a regular contributor to MarketWatch. His Hulbert Ratings tracks investment newsletters that pay a flat fee to be audited. He can be reached at mark@hulbertratings.com

