
This post was originally published on this site
Money has gushed toward stocks this year, as global central banks have kept monetary policy accommodative to fight the coronavirus pandemic.
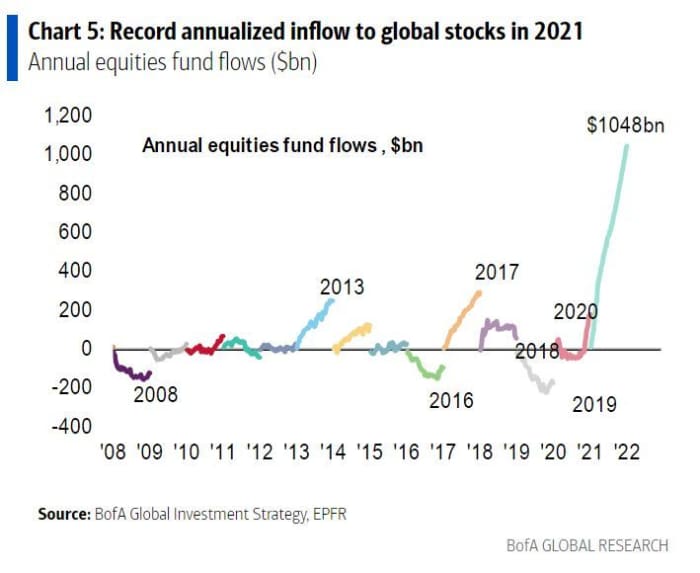
Bank of America has put those flows into perspective with the following chart that shows annualized inflows to global stocks in 2021, topping $1 trillion. That’s bigger than the cumulative inflow of the last 20 years — $800 billion between 2001 and 2020, noted Michael Hartnett, global investment strategist and his team.
Yet there were signs some investors could be steering a bit more money out of stocks, as Bank of America’s Flow Show reported that $15.2 billion was allocated to cash in the latest week, the biggest influx in five weeks. The week saw $12.7 billion allocated to equities, $12.6 billion to bonds, but $200 million out of gold
GC00,
which is traditionally viewed as a haven for investors worried about an economic slowdown.
The S&P 500
SPX,
has gained nearly 20% so far this year, which is ahead of a 16% return in 2020, though below a 28% return in 2019. On a continous basis, gold has dropped 5% this year, versus a 24% rise in 2020.
Stragetists at JPMorgan also recently commented on the rush into stocks, noting that the flows have been driven by retail investors.

