
This post was originally published on this site
Should investors be worried that the second year of the “presidential election cycle” is about to begin? Followers of the cycle answer “yes,” since second years of the cycle are the worst, on average, of a U.S. president’s four-year term.
Since the Dow Jones Industrial Average
DJIA,
was created in 1896, the Dow’s average price-only return in non-second years has been more than nine percentage points higher than in second years.
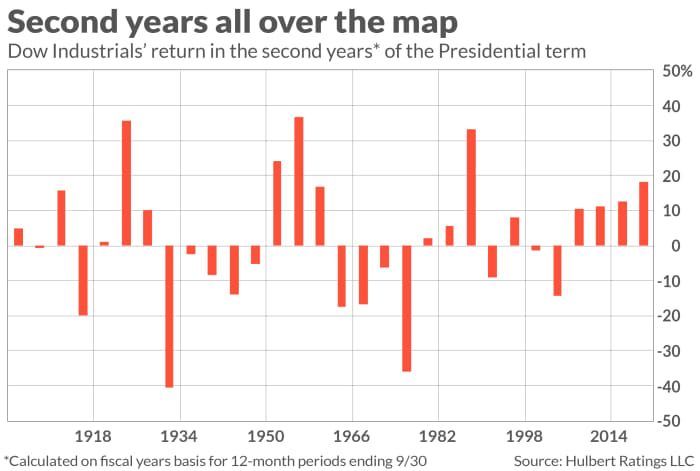
This result is not statistically significant, however. There is such wide variability in year-to-year performance that the averages don’t tell us much. In more than half of the presidential election cycle’s second years since the Dow’s creation, the U.S. benchmark index actually rose. Furthermore, as the accompanying chart shows, the Dow has risen in each of the past four second years — up 13.1% on average.
At a minimum, therefore, we need to dig deeper into the data before basing any investment decisions on supposed second-year presidential-term weakness.
History of the presidential election cycle
The presidential election cycle is based on the unobjectionable notion that presidents and their political parties want to get re-elected. They therefore will swallow any necessary economic medicine early in their terms in order for the economy to be roaring by the time the next presidential election comes around.
As many have noted before, the historical data are only loosely consistent with this theory. The table below reports the year-by-year averages for the Dow since its creation in 1896 and since 1940. This latter year was chosen on the theory that presidential power grew enormously in the 1930s, thereby increasing a leader’s ability to ignite the economy.
| Since 1896 | Since 1940 | |
| First year | 9.3% | 5.0% |
| Second year | 1.8% | 2.9% |
| Third year | 13.9% | 19.9% |
| Fourth year | 4.9% | 4.0% |
| All years | 7.5% | 7.9% |
Though second years are the worst of the cycle, the difference between its average return and that of the other three years is not significant at the 95% confidence level that statisticians often use when determining if a pattern is genuine. In fact, the only year of the four that jumps over this hurdle of statistical significance is the third year.
These results are based on fiscal years ending on Sep. 30. In focusing on fiscal years, I am following the lead of most presidential election cycle researchers. Had I chosen to focus on calendar years rather than fiscal years, the difference between second years and the other three years of the cycle would have been even less pronounced.
Midterm election and stock prices
This would otherwise be the end of the story, but for another seasonal pattern that researchers have recently documented. It turns out that the six months prior to the midterm election is a particularly weak period for the stock market, while the six months after is particularly strong.
This pattern was discovered by Kam Fong Chan, a professor of finance at the University of Western Australia, and Terry Marsh, an emeritus finance professor at the University of California, Berkeley, and CEO of Quantal International. Their study on the subject was published this summer in the Quarterly Journal of Economics.
The researchers attribute the stock market’s pre-midterm weakness to uncertainty about the outcome of those elections. Similarly, post-midterm strength can be traced to the resolution of that uncertainty. Their explanation makes theoretical sense, because the stock market reacts poorly to uncertainty.
Their theory has empirical support in the seasonal patterns of the Economic Policy Uncertainty index (EPU), which measures politically sourced economic uncertainty. Historically, the EPU has tended to rise significantly in the six months before mid-term elections and then fallen just as much in the six months thereafter.
To the extent this pre- and post-midterm pattern persists, you wouldn’t look for stock market strength until next spring — halfway through the second year of the presidential election year cycle. In the meantime, the stock market could still exhibit weakness. But if it does, it won’t be because of where we are in the cycle.
Mark Hulbert is a regular contributor to MarketWatch. His Hulbert Ratings tracks investment newsletters that pay a flat fee to be audited. He can be reached at mark@hulbertratings.com

