
This post was originally published on this site
While an economic recession carries huge repercussions, the ups and downs of the U.S. economy have little to do with the U.S. stock market’s gyrations.
Every day I review the latest newsletters and research reports from more than 100 investment advisers and Wall Street firms. It’s rare for even one of them not to focus on the prospects for a “soft landing” or, if the Federal Reserve fails, when the recession will begin and how severe it will be. What few, if any, seem to appreciate is that as far as their stock market recommendations go, their analysis signifies next to nothing.
Consider the relationship between quarterly changes in the U.S. GDP and the S&P 500
SPX,
as measured by the correlation coefficient. This statistic ranges from a theoretical maximum of 1.0 (which would mean that the GDP and the S&P 500 move up and down in perfect lockstep) to a theoretical minimum of minus 1.0 (which would mean that the two move inversely — with one zigging every time the other zags, and vice versa). A correlation coefficient at or near zero would mean there is no statistically detectable relationship between the two series.
The correlation coefficient based on the past 75 years of data is an extremely low 0.08 — close to zero. Based on a related statistic known as the r-squared, this low coefficient means that the GDP’s quarterly changes explain just 0.6% of the S&P 500’s quarterly changes.
Might these readings be artificially low because the stock market is forward looking, discounting changes in the GDP’s growth rates several quarters in advance? That seems plausible in theory, but I could find little evidence to support this possibility. The coefficient is no higher when measuring the correlation between the S&P 500’s change in a given quarter and the GDP’s four-quarters later.
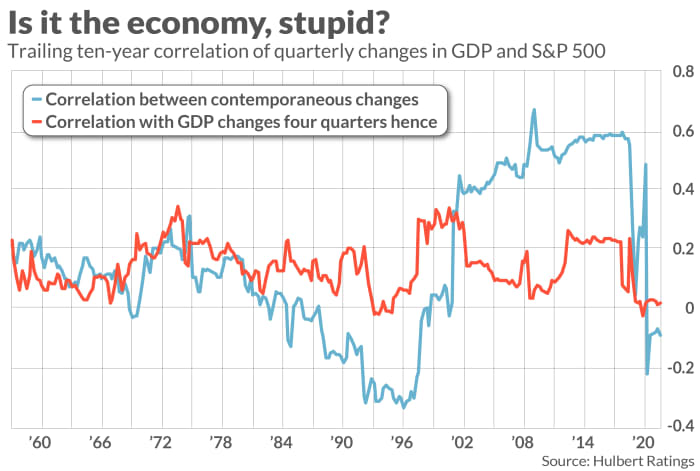
In any case, these correlations are not stable over time. As is evident from the chart above, there have been some past periods in which the correlation between the GDP and the S&P 500 was quite high, and others when it fell below zero. To use the GDP to time the stock market, therefore, investors would first have to know whether the correlation is positive, negative, or zero.
Why does GDP have little impact on stocks?
Though many are surprised to learn of the low correlation between the GDP and the stock market, it makes sense once we focus on each of the intermediate steps between a growing economy and a higher stock market. This relationship becomes more tenuous with each of those steps.
- Corporate sales: The most obvious point of impact the GDP has on the stock market is via corporate sales. The relationship between those two is much stronger than between the GDP and the S&P 500. But even here the correlation is not overwhelming: Based on quarterly data since 1954, the correlation coefficient between GDP and the S&P 500’s sales per share is 0.68. That means that changes in the GDP’s growth rate can explain 46% of corresponding changes in sales growth —or less than half.
- Profit margin: Increased sales don’t translate dollar for dollar into increased earnings. A corporation’s profit margin determines the extent to which sales translate to earnings, and that margin varies widely. According to Howard Silverblatt, a senior index analyst at S&P Dow Jones Indices, the S&P 500’s profit margin rose as high as 13.54% in the third-quarter of 2021, three times the comparable margin in early 2009 of 4.56%. Needless to say, a higher profit margin means that even flat sales can lead to higher earnings, just as a shrinking margin can turn increasing sales into declining profits.
- P/E ratio: Increased earnings don’t automatically translate into a rising S&P 500, furthermore. It’s the P/E ratio that measures the extent to which earnings are translated into stock prices, and that ratio also varies widely. The S&P 500’s current P/E ratio, based on trailing 12-month earnings, is around 23, barely half of where the comparable ratio stood at the beginning of 2021.
The bottom line? Crucial as the GDP’s growth rate is for other reasons, it isn’t so helpful in timing the stock market’s gyrations. You could win every economic forecasting award on Wall Street and still have terrible investment performance.
Mark Hulbert is a regular contributor to MarketWatch. His Hulbert Ratings tracks investment newsletters that pay a flat fee to be audited. He can be reached at mark@hulbertratings.com
Plus: Why the collapse of Silicon Valley Bank was not a black swan
Also read: Lost in the hoopla, the Fed sees a recession this year
