
This post was originally published on this site
In this article, we examine the significant weekly order flow and market structure developments driving XLE‘s price action.
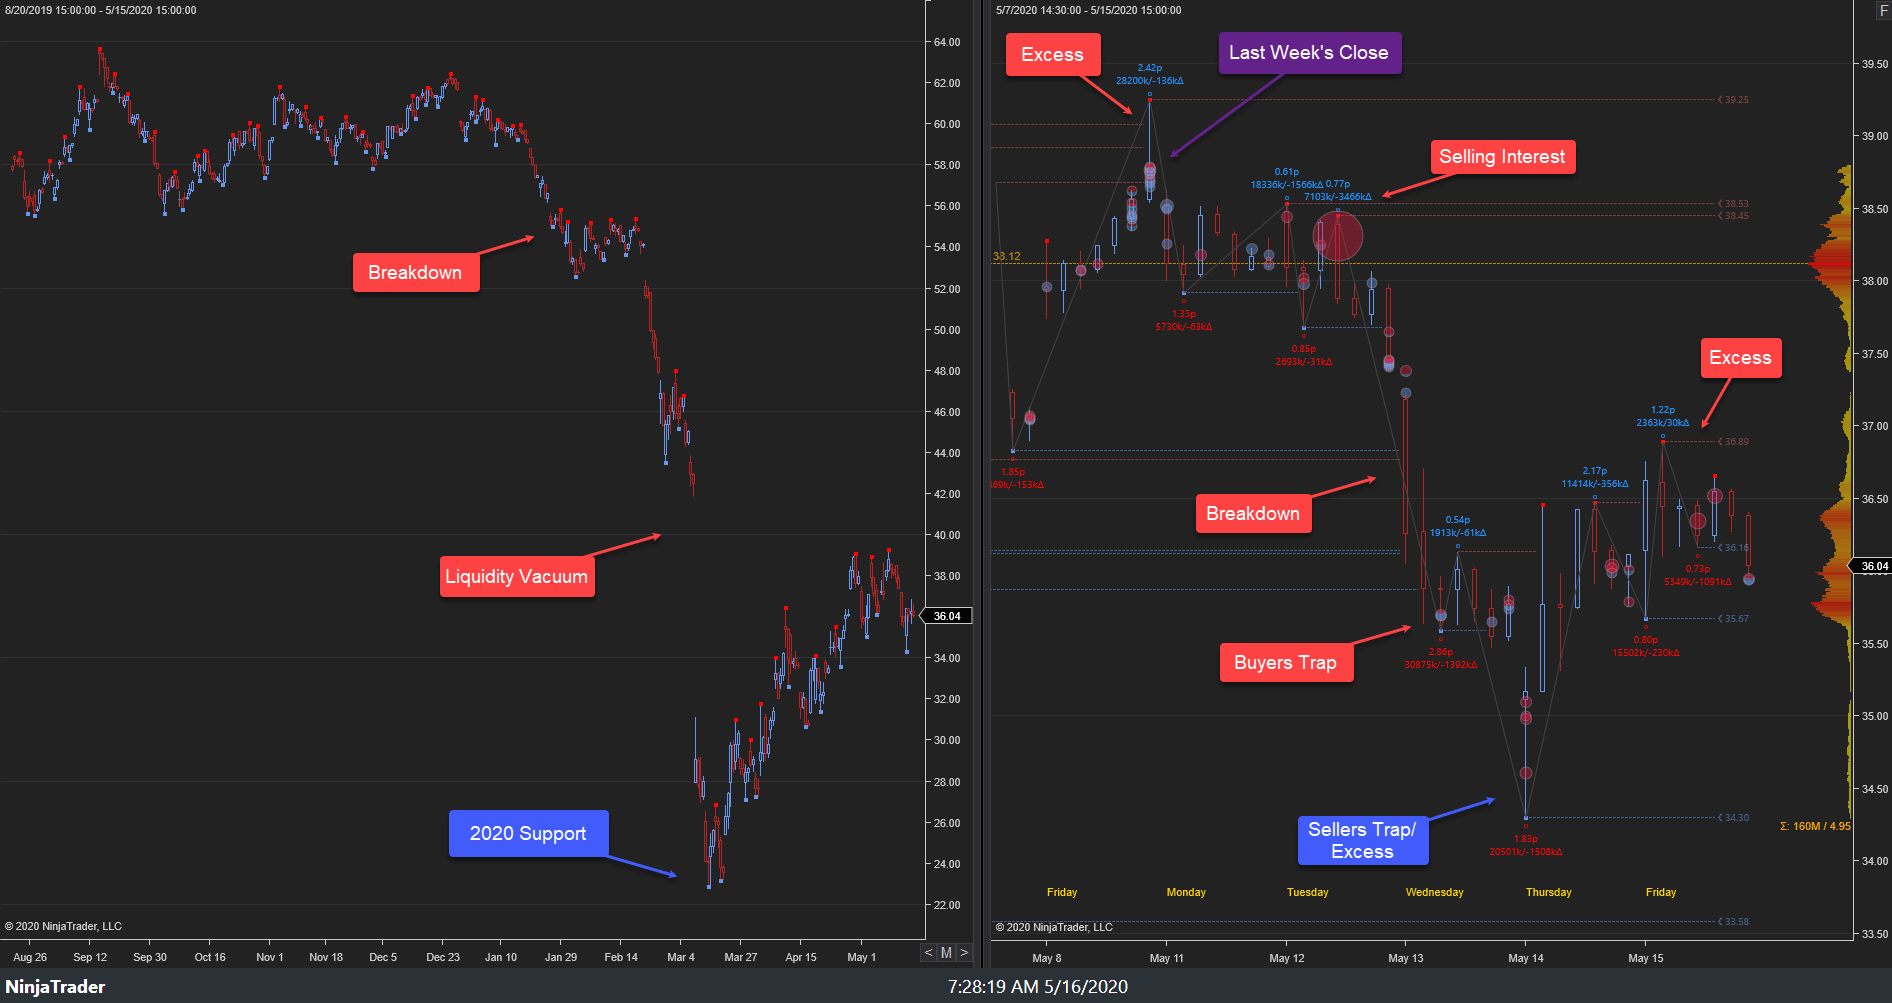
As noted in last week’s XLE Weekly, the primary expectation for this week’s auction was for price discovery lower, provided 36.90s held as resistance. This week’s primary expectation did not play out as last week’s late sellers failed to hold the auction as an aggressive rally ensued in Monday’s auction through key resistance. The rally continued to 39.63s into mid-week where sell excess formed amidst selling interest that halted the rally at key multi-month resistance. A pullback developed to 37.69s where buying interest emerged as minor rotation higher to 38.52s developed ahead of Friday’s close, settling at 38.48s.
18-22 May 2020:
This week’s auction saw last week’s late sellers fail to hold the auction as a gap higher open developed in Monday’s trade through key resistance, 36.90s. The rally higher continued in Monday’s trade to 39.18s. Buyers trapped amidst selling interest, halting the rally as a pullback ensued to 37.80s into Tuesday’s close. Tuesday’s late sellers failed to hold the auction as rotation higher developed early in Wednesday’s trade, achieving a stopping point, 39.40s.
Buying interest emerged there as narrow balance developed, 39.10s-38.92s, into Wednesday’s close. Wednesday’s late buyers initially held the auction as a buy-side breakout attempt developed in Thursday’s trade, achieving the weekly stopping point high, 39.63s, within the key resistance area. Sell excess formed amidst selling interest, halting the rally phase. The breakout failed as a pullback ensued below prior resistance to 38.41s. Buying interest emerged there, developing balance, 38.41s-39s, into Thursday’s close. Thursday’s late sellers held the auction as the pullback continued in Friday’s trade, achieving a stopping point, 37.69s. Buying interest emerged there, as minor rotation higher to 38.52s ensued ahead of Friday’s close, settling at 38.48s.
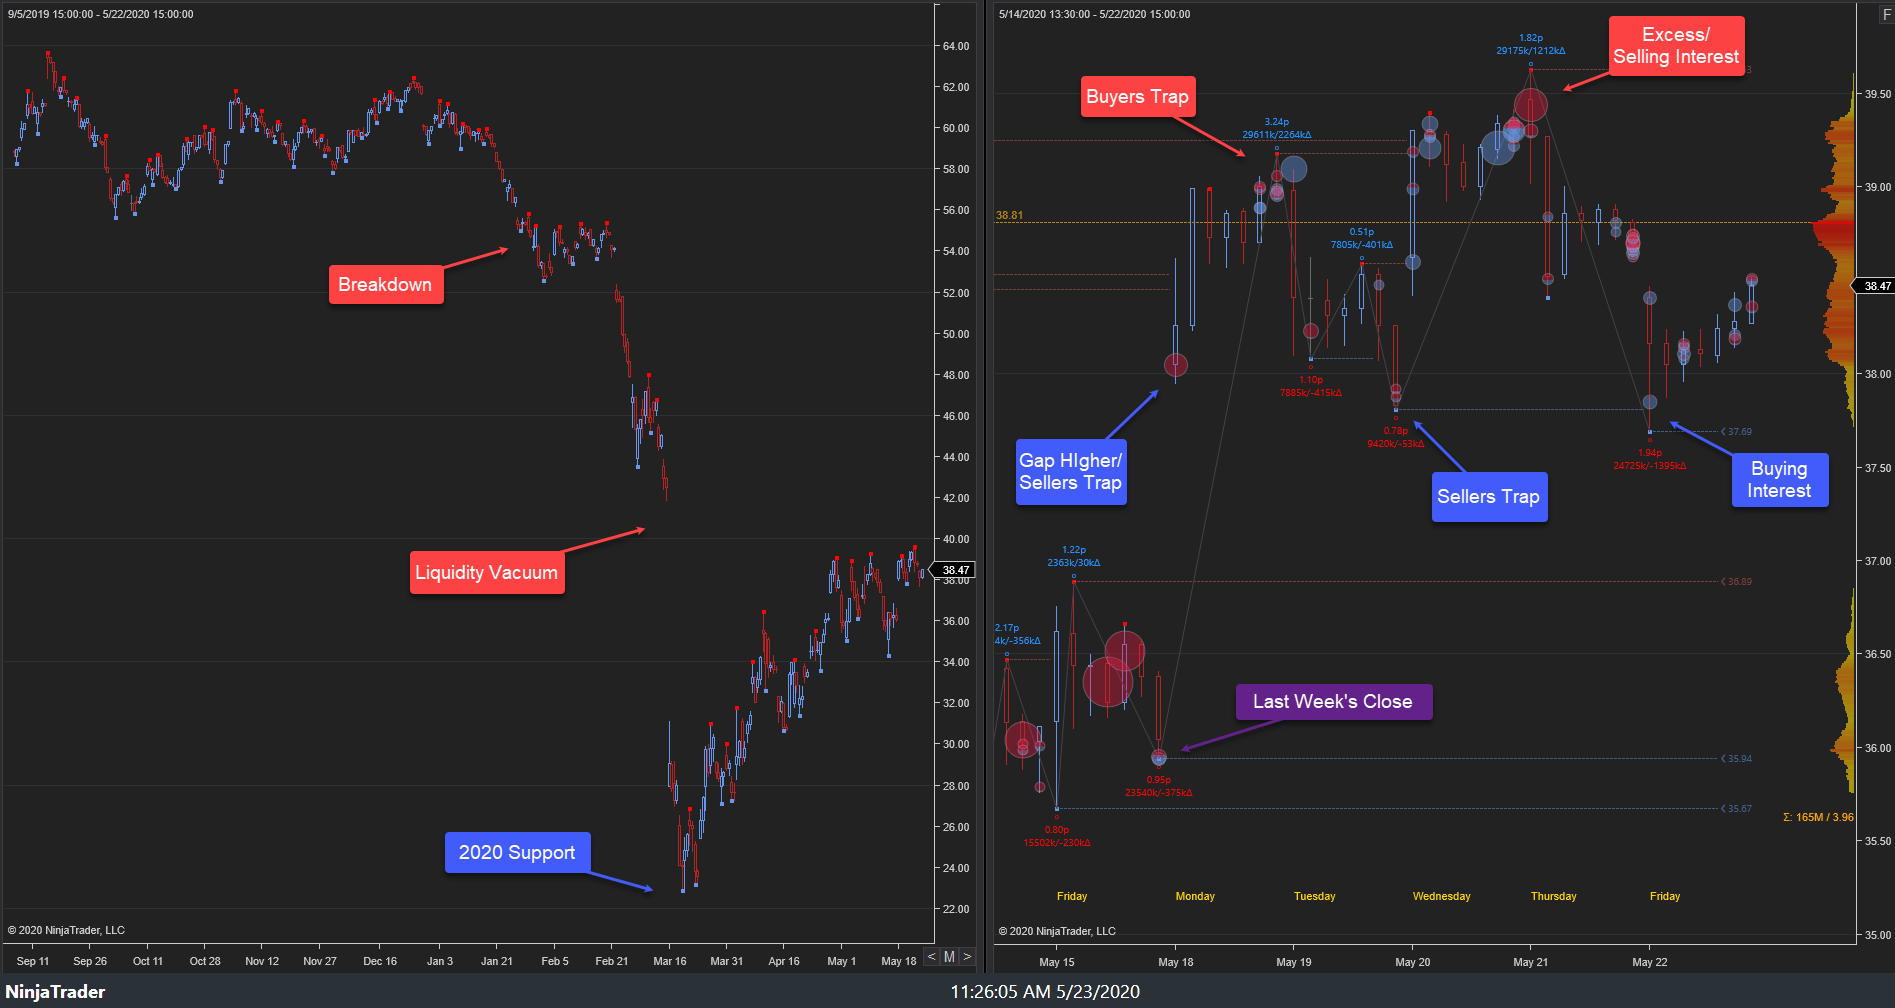
This week’s auction saw rotation higher develop to test the multi-month resistance/liquidity vacuum area from the historic selloff of February-March. A buy-side breakout failed in this area. Within the larger context, the market formed a structural support, 22.88s, and now a relief rally resistance, 39.63s, in the wake of the recent historic selloff. The rally is growing more constricted as it trades into major resistance.
Looking ahead, the focus into next week rests on response to key resistance, 39s-39.63s. Buy-side failure to drive price higher from this resistance will target key demand clusters below, 36.89s-35.67s/35s-34.30s, respectively. Alternatively, sell-side failure to drive price lower from this key resistance will target key supply clusters above, 42s-44s/52s-56s, respectively. The highest probability path for next week is sell-side provided 39.63s holds as resistance. The larger context now shifts neutral between 39.63s and 22.88s.
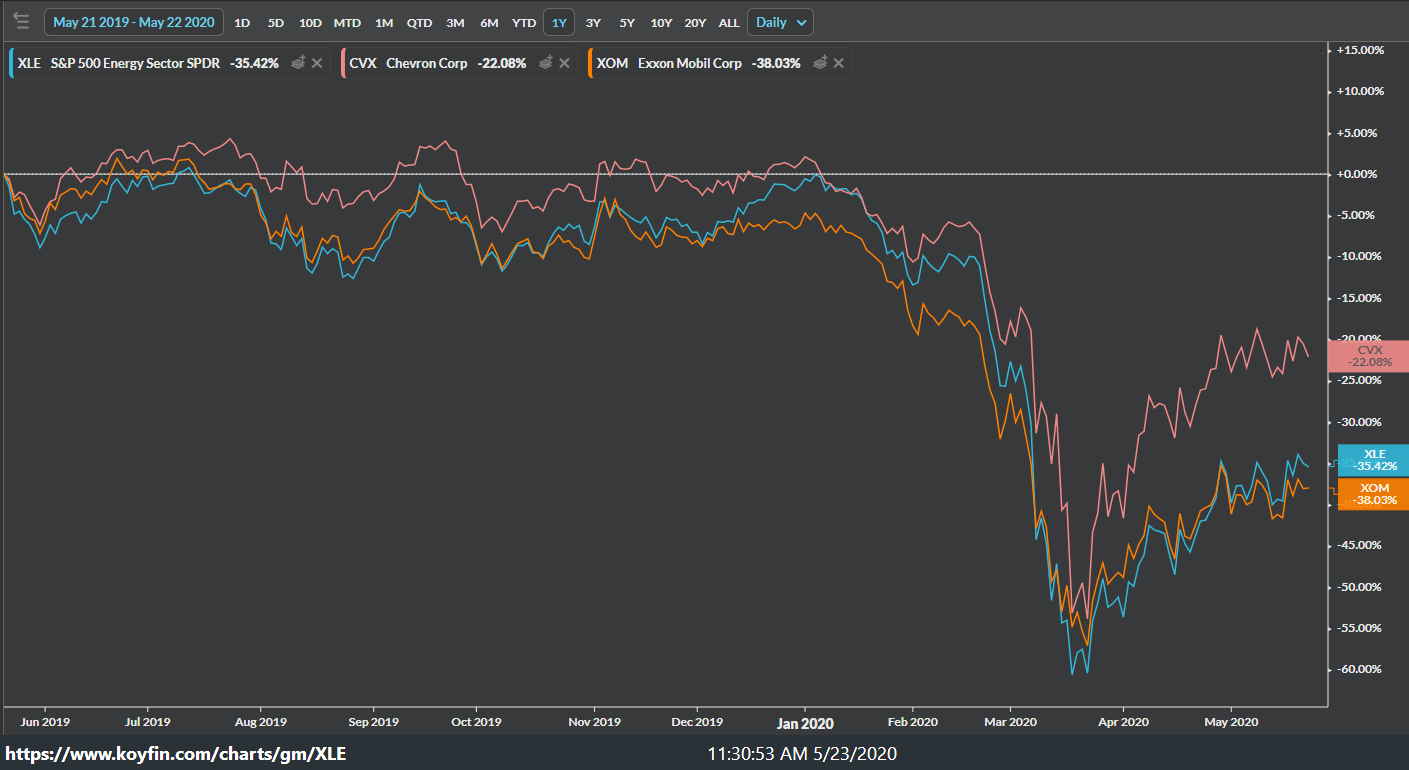
Looking under the hood of XLE, we see that its performance is really a tale of two stocks, Chevron (NYSE:CVX) and Exxon Mobil (NYSE:XOM). They account for approximately 23% and 20% of the entire ETF respectively.
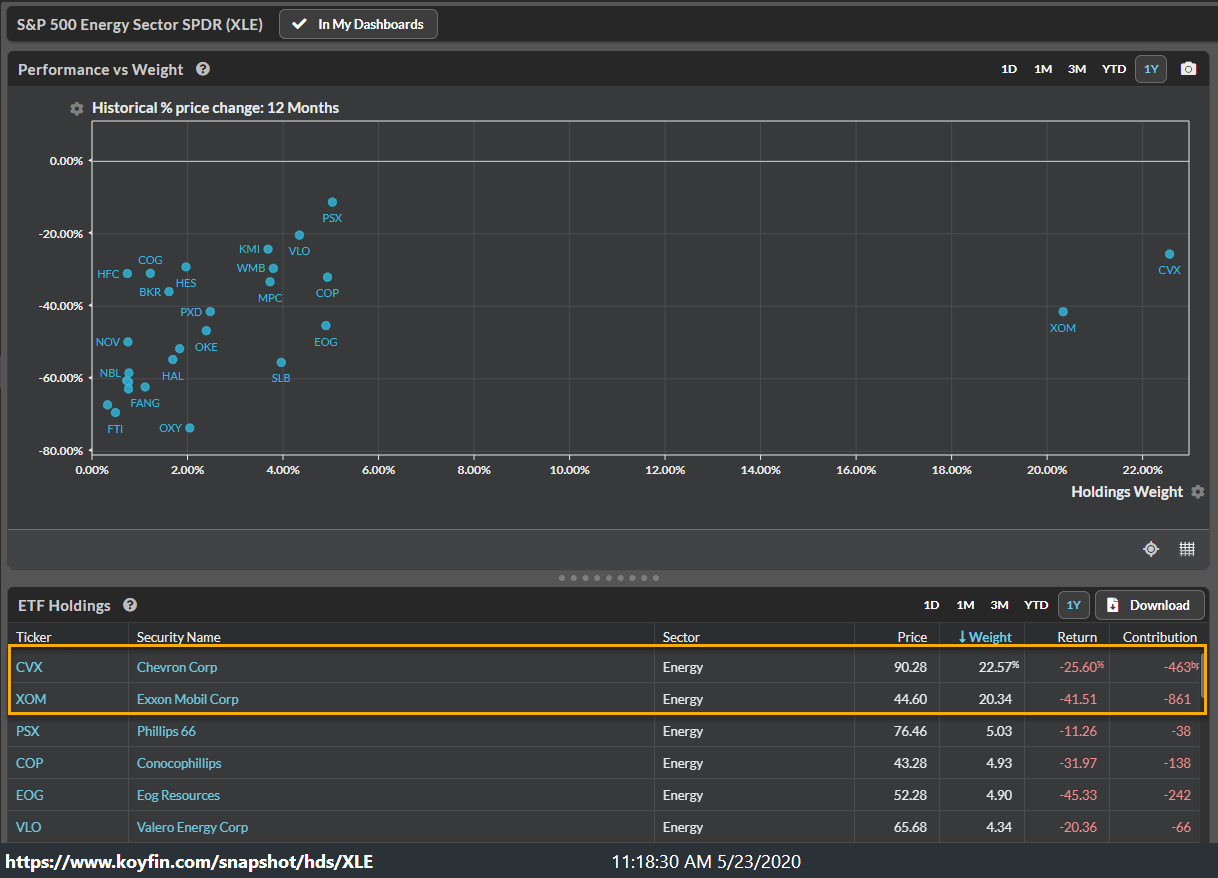
Further, their performance is responsible for -463bps and -861bps, respectively, of XLE’s current one-year performance. As go Chevron and Exxon, so goes XLE. Chevron continues to drive the bulk of the relief rally returns.
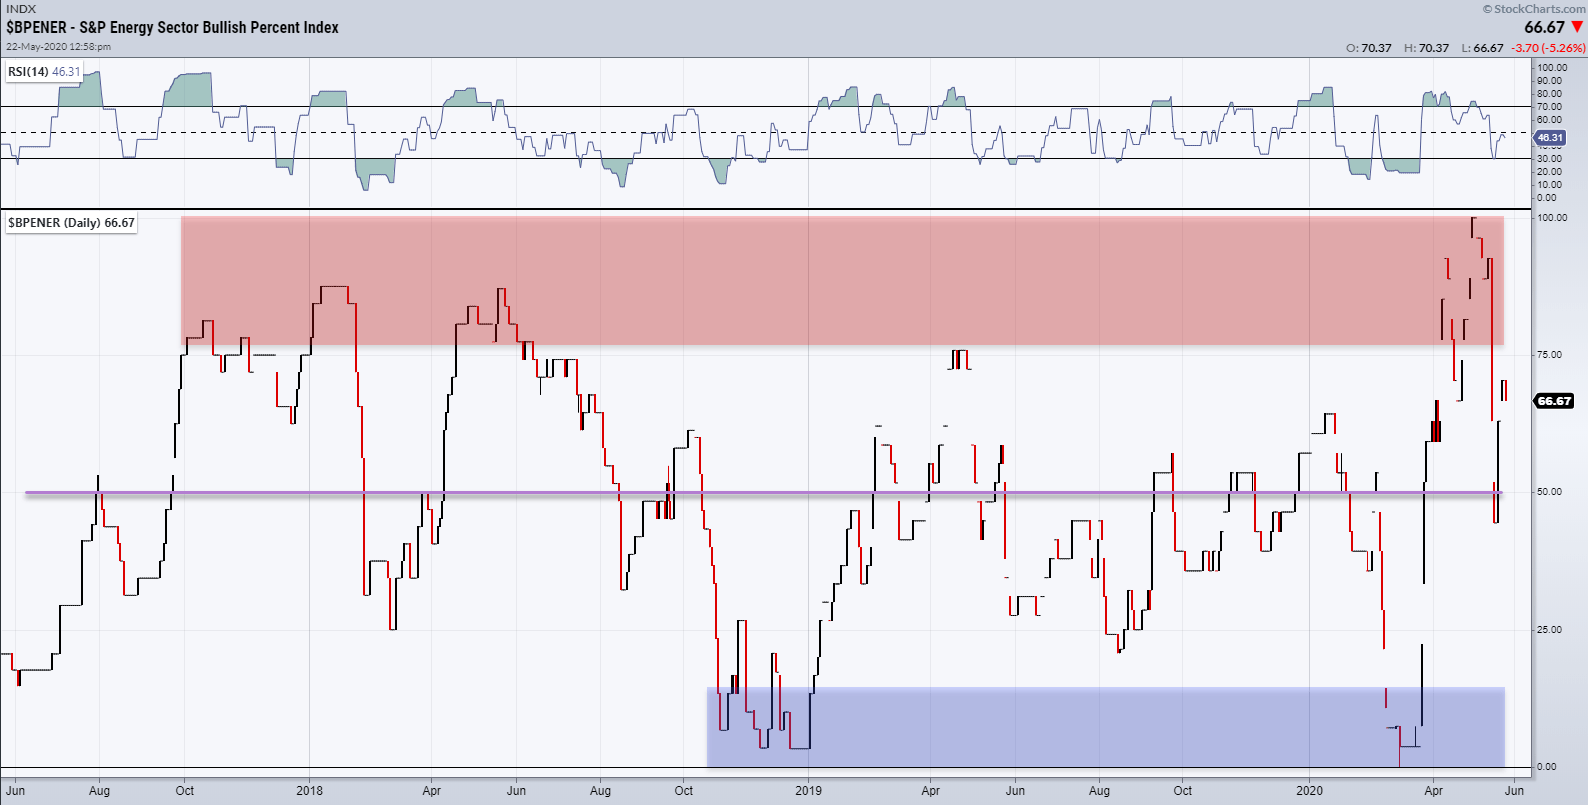
It is worth noting that breadth, based on the S&P Energy Sector Bullish Percent Index, bounced this week from the mid-range point after the recent historic downside and upside volatility. Stocks more broadly, as viewed via the NYSE, see a similar posture. Energies’ breadth is increasing and held the midpoint last week, implying continued risk-off sentiment in this sector will prevail near-term. Asymmetric opportunity develops when the market exhibits extreme bullish or bearish breadth with structural confirmation. Currently, conditions favor a neutral posture as the market found structural support, 22.88s, near late 2003 support followed by a rapid and substantial relief rally to 39.66s at multi-month resistance. The support formed in March is likely a momentum low formed before a final price low.
The market structure, order flow, and breadth posture will provide the empirical evidence needed to observe where asymmetric opportunity resides.
Disclosure: I/we have no positions in any stocks mentioned, and no plans to initiate any positions within the next 72 hours. I wrote this article myself, and it expresses my own opinions. I am not receiving compensation for it (other than from Seeking Alpha). I have no business relationship with any company whose stock is mentioned in this article.

