
This post was originally published on this site
A little over a week ago, I wrote a piece in which I argued that the United States Natural Gas Fund (UNG) was likely headed higher in the coming months. In this piece, I will expand upon this previous analysis by providing additional statistics which I believe are suggestive of higher gas prices in the immediate future. Specifically, I believe that historic analysis suggests that we could see natural gas rise by over 50% throughout the next year.
The Commodity Cycle
To start this piece off, I would like to establish a baseline “commodity cycle” concept around which I am framing the following analysis. In my opinion, there is what is known as a “commodity cycle” which shapes the price of any given commodity through time and by understanding this cycle, we can best be positioned to profit from likely future movements in any given commodity.
I generally define the commodity cycle as the cyclical pattern of supply and demand at work within any given commodity. What I mean by this is that there is a constant ongoing interplay between supply and demand forces which essentially shape future changes in the price of a commodity going forward. For example, when supply is very strong versus demand, inventories tend to rise and prices tend to fall. Conversely, when demand is strong versus supply, inventories fall and prices tend to rise.
When prices move in any given direction, it shapes the supply and demand balance going forward. For example, when prices rise due to demand surpassing supply, producers are incentivized to increase production and consumers become progressively cost aware and likely reduce consumption. And the opposite holds for a falling price environment in which producers reign in production and consumers will generally increase consumption at lower prices.
This cyclical pattern may seem purely academic but as we’ll see in a second, it is actually present in the data and it is highly suggestive of strong price increases in the near future.
Natural Gas Markets
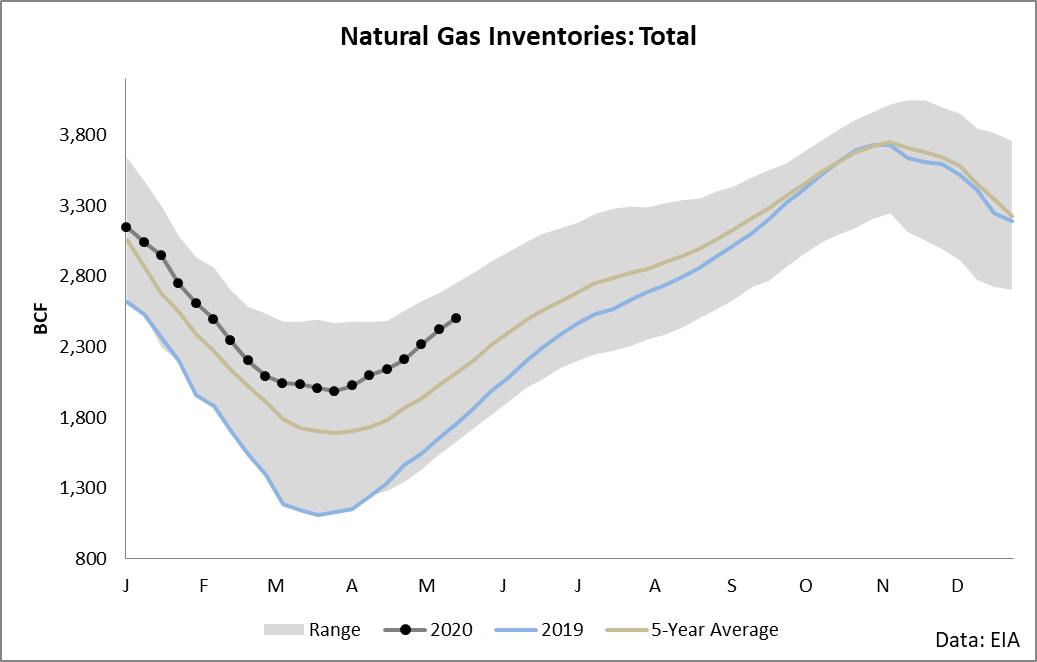
At present, we are in a market awash in natural gas with inventories climbing against the 5-year average and trending towards the top of the 5-year range.
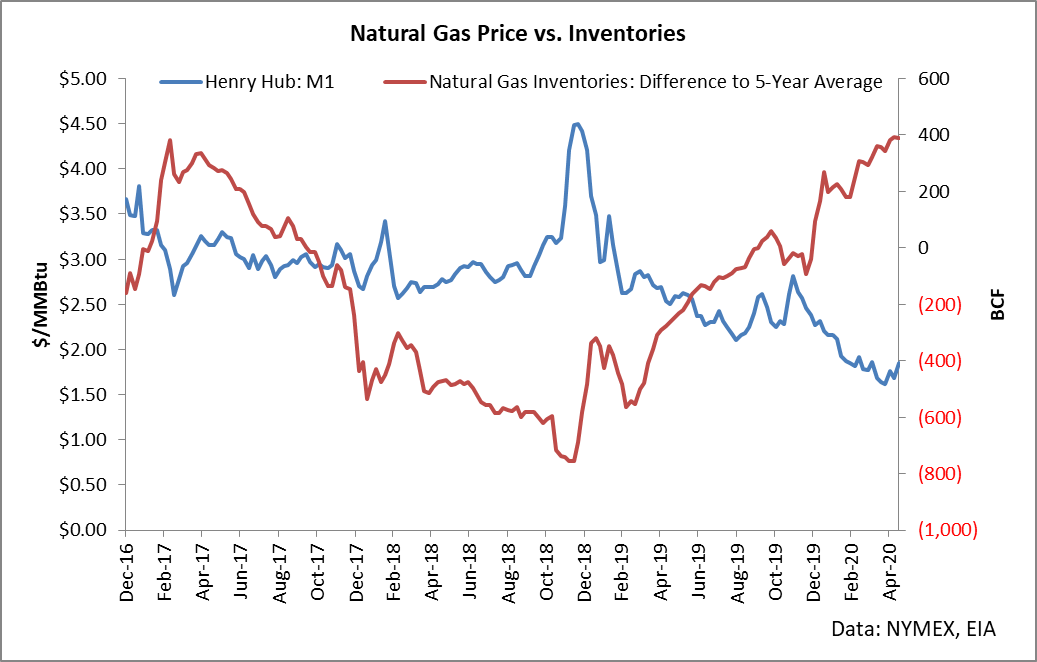
As seen from a difference versus the 5-year average, inventories continue to climb while natural gas prices continue to fall.
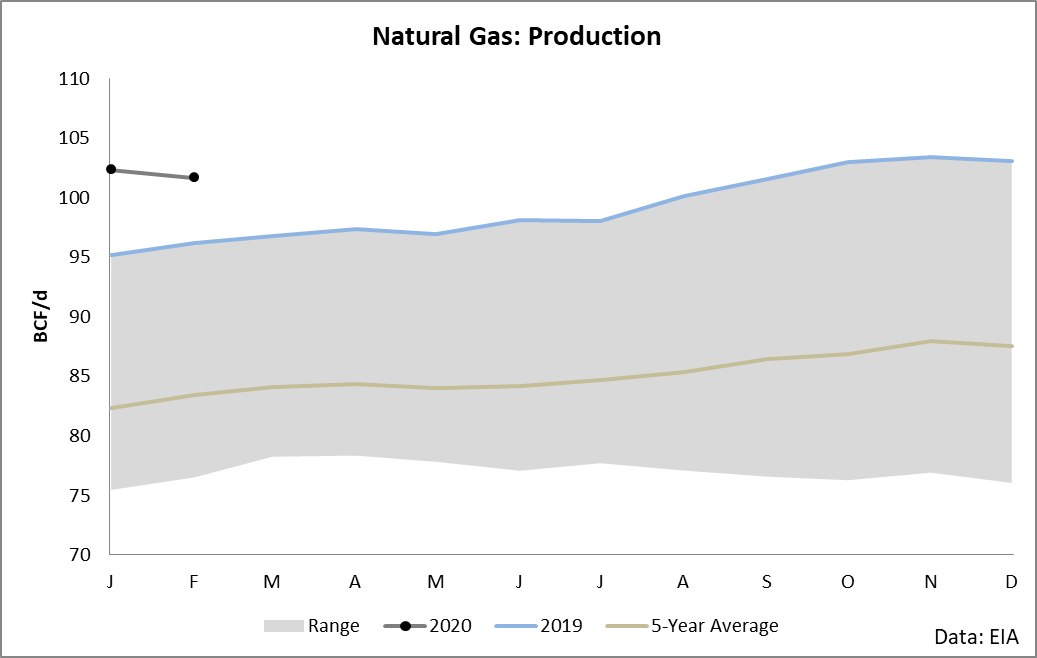
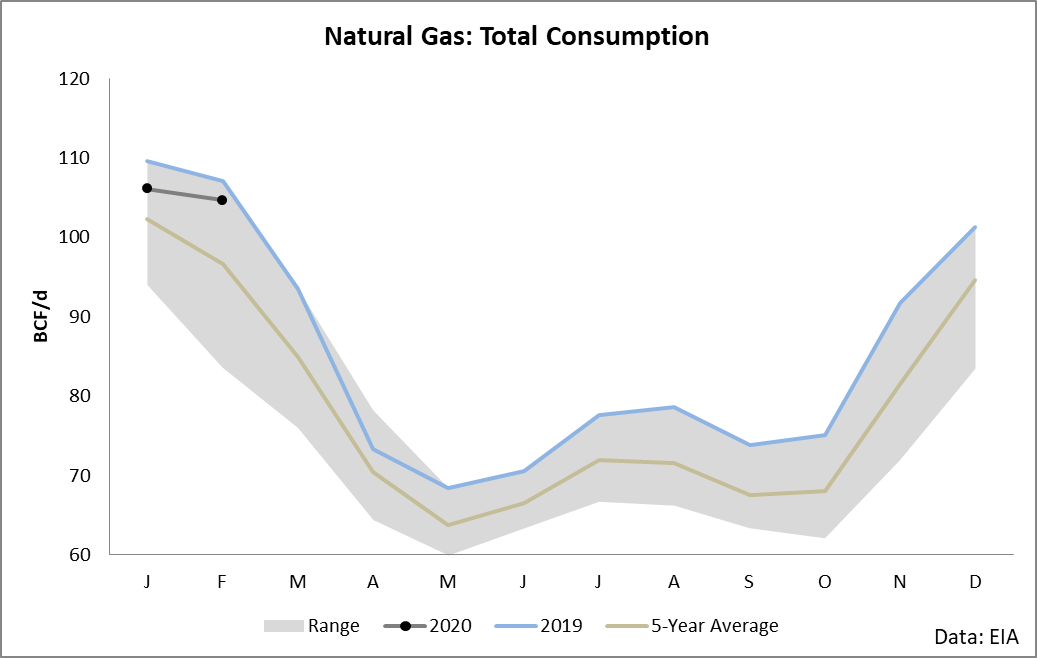
From our prior section, we are almost certainly in what some call a “down cycle” for natural gas. Supply has surpassed demand as production continues to be elevated (through the start of this year at least) while demand was very weak due to a mild winter (and continues to be weak due to coronavirus concerns).
From purely a data perspective, the numbers clearly suggest that we are in a down cycle as witnessed by balance of supply and demand: growing inventories. However, what is important to note about cycles is something which is so simple it might be missed: they are cyclical.
What this cyclicality basically means is that ultimately, when economic forces drive a commodity price in one direction, it tends to sow the very seeds necessary for the commodity to move in the other direction.
For example, we have seen inventories climb versus the 5-year average on a confluence of bearish fundamentals. These bearish fundamentals have driven natural gas prices down strongly over the past few months. However, since prices have crashed, producers are no longer incentivized to produce at the same levels of times past, so drilling activity slows.
Ultimately, this level of production will correct to the point that prices will rise (because demand surpasses supply) and the cycle repeats – as seen in 2015-2016.
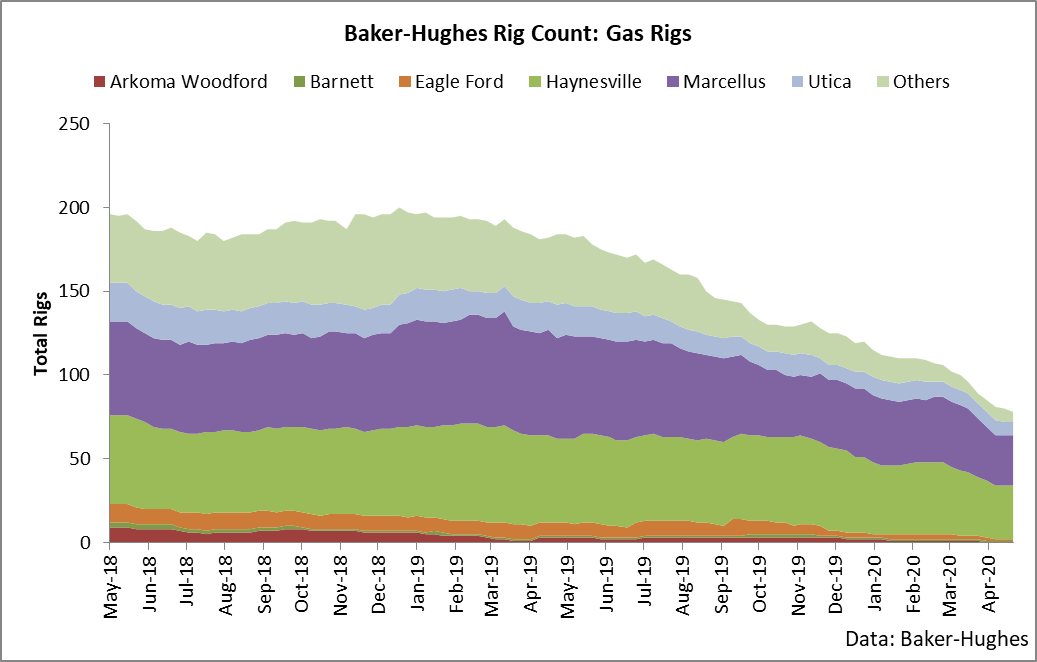
Now that we’ve established a general theory for commodities markets and shown the theory at work in the data, I want to turn to the predictive power contained in the data. Natural gas is a fascinating market to me in that the fundamentals, in aggregate, are highly repetitive and predictive. That is, if you look at the first chart in this article, the clear seasonal pattern of draws during the winter and builds during the summer is firmly established in the data – in fact, it is typically just variations against averages which lead to large changes in price.
All this said, the clear cyclical nature of the price changes of natural gas as a response to overall fundamental patterns can also be seen in the data. For example, here is a chart that shows the future changes in the price of natural gas versus the past year-over-year change in natural gas for that particular data point.
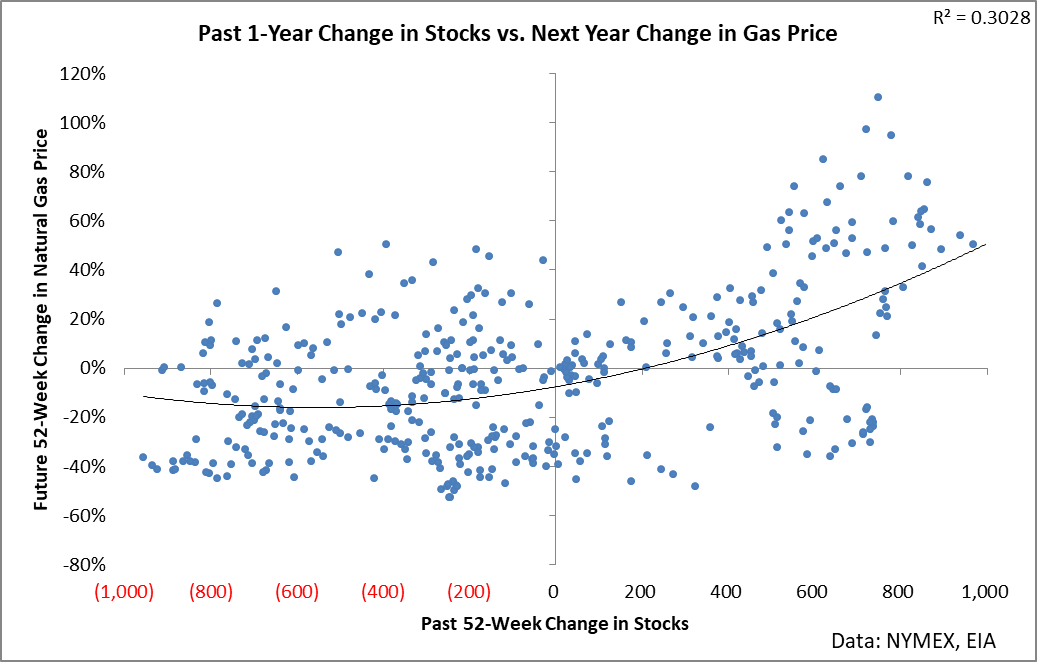
Let’s take a moment to examine this chart and think through what it means. This takes the past several years of data and looks at the year-over-year change for every week compared to what happened to the price of natural gas over the next year. In other words, it shows what happened in the future compared to what happened in the past at each data point.
What this chart shows is that there is a clear (while not perfect) trend in which if you have seen a large build in stocks over the past year, you are likely to see a large upward gain in the price of natural gas over the next year. In other words this model essentially suggests that you should trade against extremes in the data. Said another way, when things look very bad as seen by surging inventories, we should start looking to buy natural gas. This is the classic contrarian mindset – and it shows profit in the data.
Okay, but where are today in this overall picture. Good question. Over the last few weeks, we have seen this year-over-year change in natural gas inventories reach as high as 898 BCF. In other words, the current year-over-year increase in natural gas inventories is hovering around 800-900 BCF.
If you look at the chart above, you can see that using about the last decade of data, we have never seen a time period in which gas inventories rose by this amount that wasn’t followed by a strong increase in the price of natural gas. Seen another way, here is the average 1-year change following an increase in natural gas inventories bucketed by size.
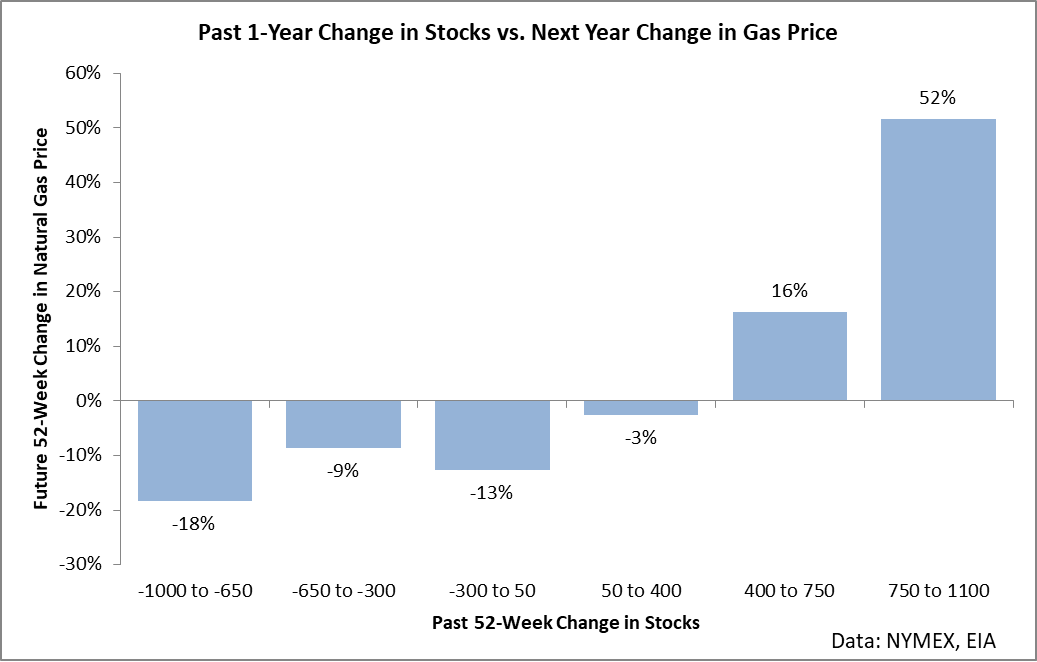
As you can see, the average 1-year return for natural gas prices following a build of comparable size to what we have recently seen is 52%. In other words, historically speaking, when we have seen inventories build at the pace we are currently seeing, on average natural gas rallied by 52% over the next year.
This is my call for UNG over the next year (minus a few points for roll yield). UNG is holding the front month futures contract and this analysis examines changes in this futures contract. In other words, this analysis is directly making a call on the price of the futures UNG holds. If we see the historic average play out once again, UNG will rise by a little under 52% over the next year (and the range suggests that gains as high as 100% are possible).
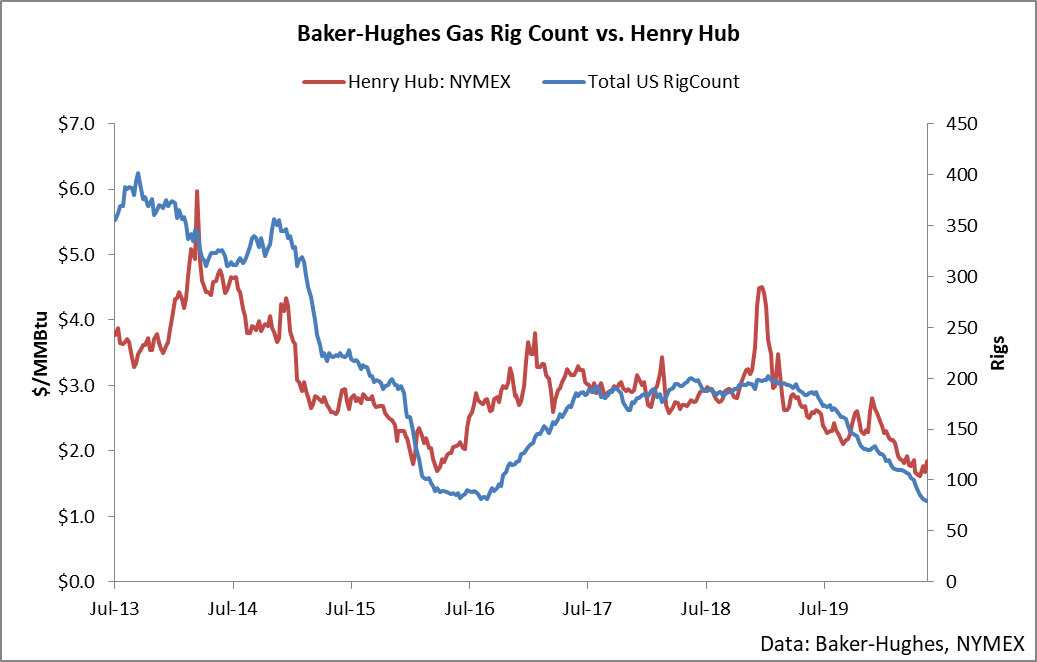
This may seem bombastic or a dreamy forecast based on the current bearishness seen in the market. However, this is the simple commodity cycle which is taught in many economics courses evident in the data. We have reached a point where inventories have climbed to unsustainable levels on a year-over-year basis and natural gas production is correcting as a result. We have seen the rig-count drop and the EIA is calling for gas production to drop by over 10% throughout the next year.
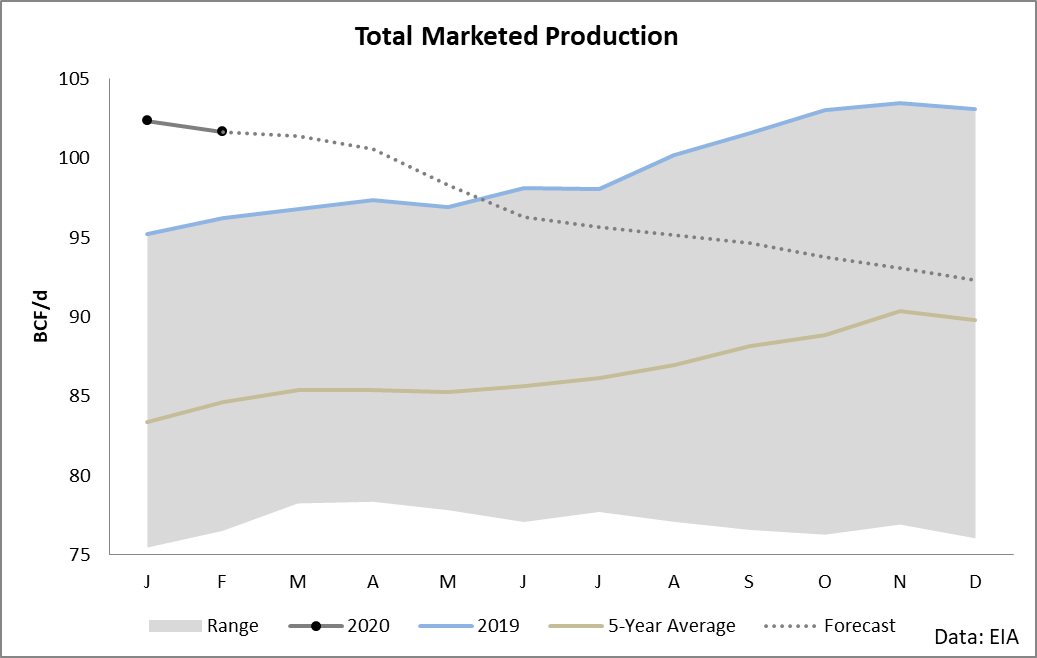
Also, as a check figure here – I’d encourage you to look at the EIA’s Short-Term Energy Outlook. This is a government agency with no market position – and they are seeing the same fundamentals at work. If anything, my analysis is conservative against their call. For example, they are calling for the spot price of natural gas to reach $3.06/MMBtu by December which is a gain of over 80% above the price at time of writing.
In consideration of all of these variables, I reiterate my call to buy UNG and I am increasing my bias to “very bullish”. As mentioned earlier, roll yield will take a slight drag on shares (I calculate it at about 12% per year), however the numbers strongly suggest that UNG is headed higher from here.
Conclusion
There is a clear “commodity cycle” at work in the fundamental data which allows us to study the market and position accordingly. Natural gas rallies by an average of 52% over the year following similar changes in inventories to which we are currently witnessing. If anything, a call for a 52% rise in natural gas is conservative versus the EIA which has an 80% rise baked into its data.
Disclosure: I/we have no positions in any stocks mentioned, and no plans to initiate any positions within the next 72 hours. I wrote this article myself, and it expresses my own opinions. I am not receiving compensation for it (other than from Seeking Alpha). I have no business relationship with any company whose stock is mentioned in this article.
