
This post was originally published on this site
The S&P 500 has only fallen 5.5% from its late-July high, and already many investors are scanning for signs that the stock-market pain might be coming to an end.
With that in mind, Seaport Research Partners Victor Cossel shared a few technical charts that could offer some clues about the timing of a potential turnaround. But the upshot — at least for now — is that there’s likely more pain ahead, unless the relentless march higher in Treasury yields and the U.S. dollar ends.
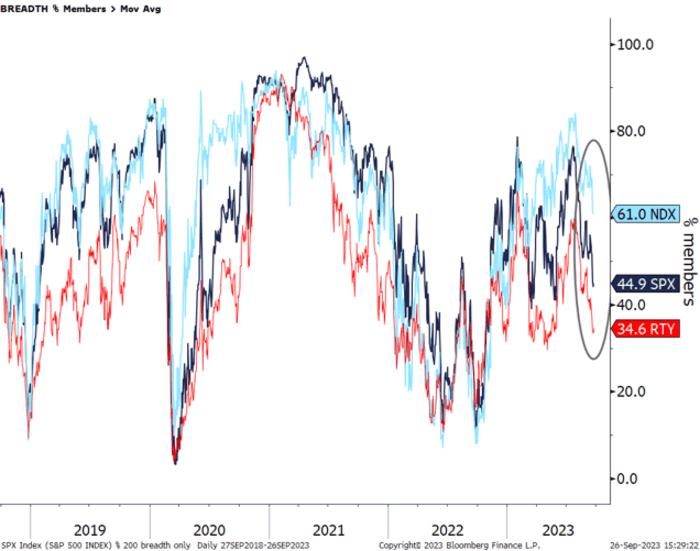
First, the percentage of Nasdaq 100 components trading below their 200-day average needs to catch down to the number of S&P 500 and Russell 2000 members trading below their 200 DMAs.
SEAPORT GLOBAL
Moving averages are used by analysts to gauge the directional momentum in a given security. Looking at these trends among index components can give analysts an idea of exactly how dependent an index’s performance has been on a small core group of stocks, a phenomenon that has been prominent in U.S. equity markets all year thanks to the emergence of the “Magnificent Seven.”
The “Magnificent Seven” is a group of megacap technology stocks that have seen the biggest boost from the artificial-intelligence craze. It includes Nvidia Corp.
NVDA,
Microsoft Corp
MSFT,
, Apple Inc.
AAPL,
Meta Platforms Inc.
META,
Tesla Inc.
TSLA,
Amazon.com Inc.
AMZN,
and Alphabet Inc.’s Class A
GOOGL,
and Class C
GOOG,
shares.
According to the latest numbers supplied by Cossell, which were accurate through the close of Monday’s trading, 61% of Nasdaq 100
NDX
members were still above their 200-day moving averages, compared with 45% for the S&P 500
SPX
and 35% for the Russell 2000
IWM,
although those numbers may have changed slightly following Tuesday’s bruising selloff in U.S. stocks.
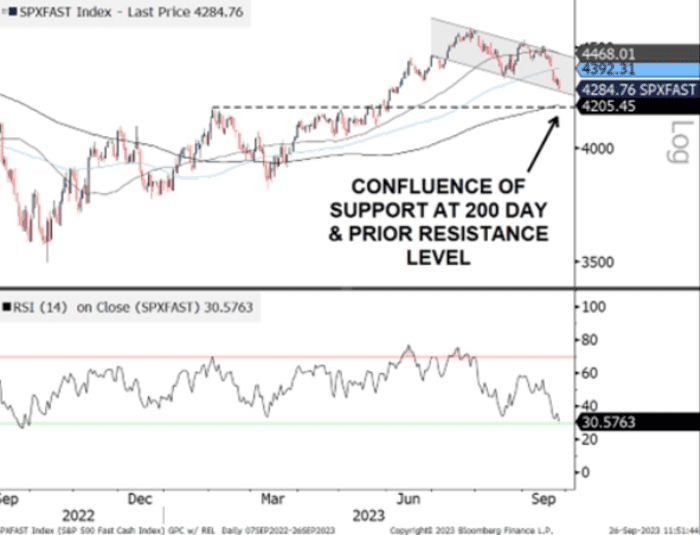
Should the selling pressure intensify, traders will be looking to see if the S&P 500 can hold the line at 4,200, which has served as a long-term support level for the large-cap index.
SEAPORT GLOBAL
A break below 4,200 could spell more trouble for stocks ahead, since traders would likely see such a break as a signal that momentum is accelerating to the downside.
However, some of the frothiness in the market that likely inspired, at least in part, the Federal Reserve’s latest higher-for-longer guidance is starting to disappear.
For example, the S&P 500 information-technology sector officially entered correction territory Tuesday when it closed at 2,869.6 after falling 1.8% on the day. The drop brought the index down 10.5% from its 52-week high of 3,207.29. A stock or index is said to be in correction territory once it has fallen 10% or more from recent highs.
The central bank’s plans for interest rates unveiled after the close of its September policy meeting have been widely blamed for driving recent moves in Treasury yields and the dollar.
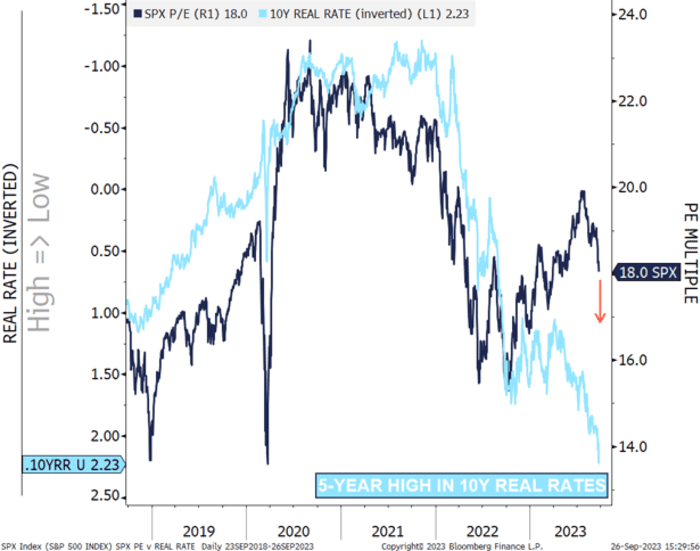
To be sure, rising real rates — that is, bond yields adjusted for inflation — could continue to create headaches for stocks. As Cossel showed in a chart from earlier this week, the S&P 500’s valuation on a forward price-to-earnings basis remains conspicuously stretched based on where 10-year real rates are trading.
The 10-year real rate Cossel used here measures the 10-year nominal Treasury yield
BX:TMUBMUSD10Y
adjusted for the 10-year breakeven spread.
SEAPORT GLOBAL
“Unless rates fall, the S&P 500 looks vulnerable at current levels,” Cossel said in the note.
U.S. stocks closed sharply lower Tuesday, with the Dow Jones Industrial Average
DJIA
seeing its worst daily drop since March, while Treasury yields pushed higher and a popular gauge of the U.S. dollar’s value reached its highest level in 10 months. The ICE U.S. Dollar Index
DXY,
the gauge mentioned above, rose 0.2% to 106.18.
The Dow fell 338 points, or 1.1%, to 33,618.88, the S&P 500
SPX
shed 63.91 points, or 1.5%, to 4,273.53, and the Nasdaq Composite
COMP
fell 207.71 points, or 1.6%, to 13,063.61.

