
This post was originally published on this site
Maybe forget about finding a crystal ball for stocks.
It’s “Finance 101 stuff” that Treasury rates need to stabilize before it’s possible for investors to gauge if U.S. equities have hit bottom, according to Nicholas Colas, co-founder of DataTrek Research.
Since Treasury rates provide the “bedrock of capital asset-pricing models,” without knowing if longer-term rates will settle anywhere from 2% or 5%, investors can’t know the cost of capital “that discounts corporate cash flows to create stock prices,” Colas said in a Monday client note.
Patches of rate stability have been fleeting in recent months as Federal Reserve Chairman Jerome Powell focuses on steering the U.S. economy into a “softish landing,” while fighting high inflation by aggressively raising the central bank’s policy rate and reducing its nearly $9 trillion balance sheet.
In roughly the past month alone, the 10-year rate
TMUBMUSD10Y,
swung to a new one-year high of 3.124% on May 6, only to revert Friday to 2.785%, or its lowest level since April 26, according to Dow Jones Market Data.
This matters because “until investors see greater stability in long-run Treasury prices, it is unlikely they will feel confident that U.S. equity valuations have really troughed,” he said.
Finding a bottom
Investors hit with sharp stock-market losses this year also have been dealt a gut-punch from bonds.
The S&P 500 index
SPX,
traded briefly in bear-market territory on Friday, before rallying. The large-cap benchmark bounced higher again Monday to close 17.2% down from its recent peak, leaving investors to wonder if it’s time to buy the dip.
Rate volatility had been pegged as the main culprit of negative total returns on bonds earlier this year. However, some cracks also appear to be forming recently in parts of corporate credit, particularly as some formerly high-flying tech companies juggle layoffs and losses, and big-box retailers see a pullback in consumer spending on what they have in stock.
A key way bond investors gauge shifting market sentiment is by tracking credit spreads, or the premium that investors earn above a risk-free rate on bonds to help account for default risks.
Colas pegged the recent widening in U.S. investment-grade corporate bond spreads as “nowhere near” the levels seen around the 2011 Greek debt crisis (see chart) or the 2016 growth scare from slowing Chinese economic growth and plunging oil
CL00,
prices.
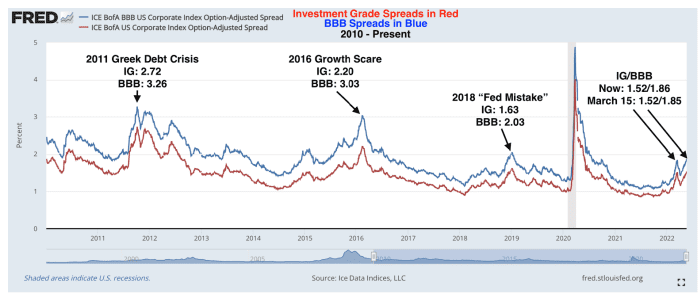
Corporate bond spreads near Greek crisis levels.
ICE Data Indices, Data Trek Research
“On the plus side, the investment-grade corporate bond market is not yet pricing in a recession or even a growth scare,” Colas said, even if spreads can still widen a lot from here.
The bigger question is, can a blowout in either investment-grade
LQD,
or high-yield
HYG,
corporate bond spreads telegraph when stocks will hit a bottom? Looking back through two decades of selloffs produced mix results, according to a CreditSights report on Monday.
A more accurate signal, however, was found when looking at the rate of change of spreads (see chart), which peaked for both investment-grade (IG) and high-yield (HY) about 42 days on average before the S&P 500 hit bottom in major market selloffs since 1998.
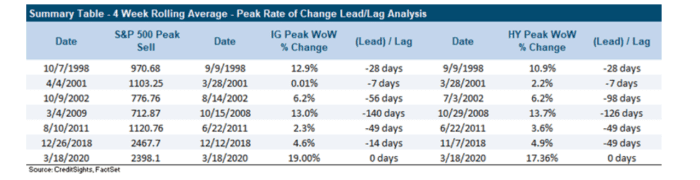
Peak volatility in corporate bonds preceded past stock-market bottoms.
CreditSights. FactSet
The hard part is knowing when corporate bond volatility has peaked.

