
This post was originally published on this site
California and Texas could not be more different from each other, as common sense suggests and a recent academic study quantifies.
The paper, written by a professor at the University of Texas Austin and another at Stanford University, doesn’t draw any conclusions about whether Texas’ small-government approach is better than California’s embrace of the role of the state. What it does offer is plenty of real-world evidence about how each regime impacts residents.
Most fundamentally, California’s state and local governments spent $16,145 per state resident in 2019, the most recent data available from the U.S. Census Bureau. In Texas, spending totaled just $10,024 per resident. Revenues per resident were similarly different: $16,879 in California to $9,997 in Texas.
GDP per capita is 22% larger in California ($79,405) than in Texas ($65,077), but a great deal of the per capita GDP in California comes from the public sector, which is one-third larger than that in Texas.
So where does the money go?
The biggest category of state and local spending in Texas was education, while in California it was social services and income maintenance, which mostly represents spending on Medicaid. As the researchers note, one in three California residents are enrolled in Medicaid, versus only 16% of Texas.
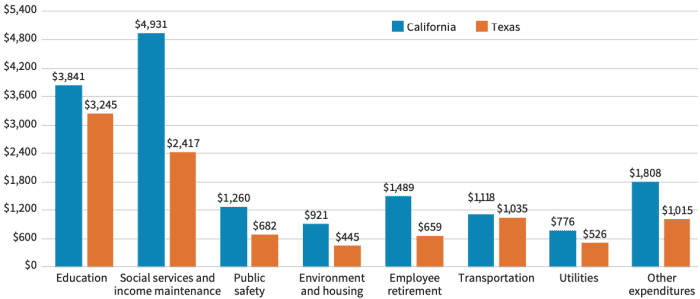
Source: A tale of two states: Contrasting economic policy in California and Texas, by Mark Duggan and Sheila Olmstead; Census Bureau data
“California also spends much more on hospitals and other health care at $1,533 per resident versus $953 in Texas,” they write. “The difference in this category explains almost half of the difference between the two states in total per capita state and local spending.”
California spends nearly double what Texas does on public safety ($1,260 per capital versus $682) and environment and housing ($921, compared to $445 in Texas.)
What do these metrics mean for quality of life?
Per capita income in California has grown faster than it has in Texas, and in the nation as a whole — and that gap has widened “substantially” in the five years from 2015 to 2020. As shown in the table below, that was happening before the boost higher-income earners got during the COVID recession.
| CA | TX | US | |
| 2000 | $50,143 | $42,284 | $46,075 |
| 2010 | $51,779 | $45,419 | $48,112 |
| 2019 | $67,554 | $53,469 | $57,159 |
| 2020 | $71,480 | $54,841 | $59,729 |
| Source: A tale of two states: Contrasting economic policy in California and Texas, by Mark Duggan and Sheila Olmstead; BEA data | |||
As the researchers note, “changes in average income alone do not capture how the distribution of income is changing over time. For example, an area’s per capita income could soar with little improvement for the most disadvantaged.” But the number of state residents with incomes below the federal poverty line has declined in both states compared to the nation as a whole.
Bigger government in California also means that only 7.7% of state residents lack health insurance, while Texas, with 18.4% of its residents uninsured, was the state with the lowest rate of health insurance coverage in 2019. That reflects a decision to expand Medicaid in California, and to avoid doing so in Texas.
Read: 12 states still refuse to expand Medicaid. Why that’s a problem for all of us
In addition, as the researchers note, in both states, the state government raises slightly more revenue than local governments do, but local governments actually spend slightly more, because they receive revenues from the state.
“In California, state transfers account for nearly one-third of local government revenues while the corresponding share in Texas is just one-fifth,” the researchers write. “This likely reflects a greater effort in California to transfer funds from high- to low-income parts of the state.”
While California may sound like a friendlier place to live, based on the metrics above, it’s important to note another important component of its economic health: population growth.
In the case of these two states, people are voting with their feet. Net migration from California to other states more than tripled from 2015 to 2020 — from 80,000 to 242,000. Meanwhile, more people kept moving to Texas than leaving.
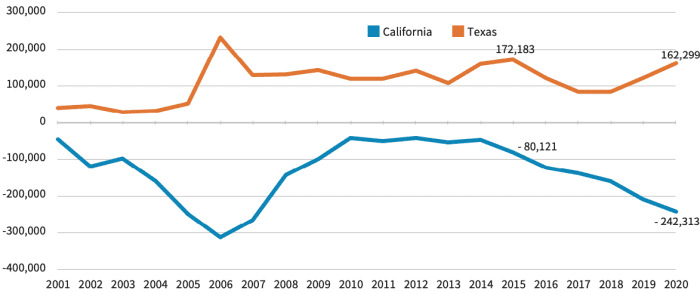
Source: A tale of two states: Contrasting economic policy in California and Texas, by Mark Duggan and Sheila Olmstead; Census Bureau data
“For the first time since it became a state more than 170 years ago, California’s influence in Congress is set to decline, with its delegation shrinking from 53 to 52 beginning in 2023,” the researchers write.
