
This post was originally published on this site
U.S. stocks remain in a strong bull market despite recent choppiness, as the correlations between 11 S&P 500 sectors and the major index are sending some positive signs, according to DataTrek Research.
The S&P 500’s sector correlations to the large-cap index have been below the average since mid-April, which means investors are more focused on fundamentals than macroeconomic forces as they try to outperform by picking what they hope will be winning sectors and stocks in a bull market, said Nicholas Colas, co-founder of DataTrek Research.
“… by this measure U.S. large caps remain in good shape,” wrote Colas in a Tuesday note. “Investors are still focused on fundamentals rather than macro issues, which is the way it should be. Yes, stocks got ahead of themselves at the end of July and likely still need some time before they turn higher again, but the correlation data says we remain in a longer-term bull market.”
Colas said normally in bull markets, investors hope to beat the broader stock market by selecting top gainers and sectors, so corporate and industry fundamentals matter more than macroeconomic factors such as interest rates, recession risks and geopolitical concerns.
As a result, the correlation between the S&P 500 sectors and the index would be lower than average because bull markets have both winners and losers, so the index moves up slowly, Colas said.
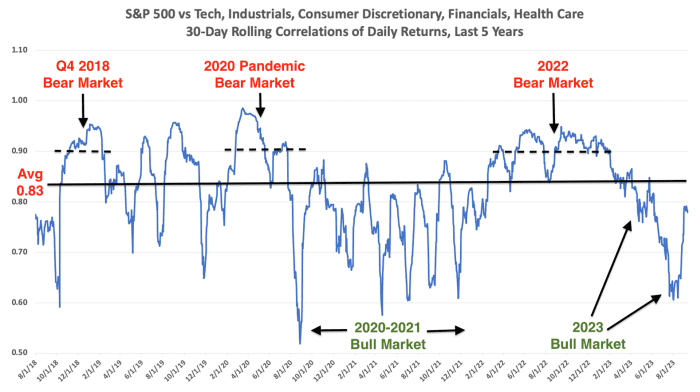
The following chart captures these dynamics. Over the last five years, the average correlation of the five largest sectors in the S&P 500 to the index as a whole has been 0.83, according to data compiled by DataTrek.
A correlation value close to zero indicates a weak relationship between the two variables being compared, while a value close to one means a strong correlation between them.
SOURCE: DATATREK RESEARCH
Colas said if correlations run consistently below 0.83, a bull market is underway, but if they reach and hold at 0.9 for more than a few weeks, that means stocks are in a bear market.
“By this measure, we are in a bull market right now. Correlations have been below average since mid-April 2023 and remain so even now,” said Colas.
The S&P 500
SPX
officially exited its longest bear-market run since 1948 and entered the bull market in early June. The S&P 500 Consumer Discretionary Sector
XX:SP500.25
and the Communication Services Sector
XX:SP500.50
have advanced 34.8% and 43.4% year to date, respectively, compared with the S&P 500’s 16.2% gain so far this year, according to FactSet data. The S&P 500 Consumer Staples Sector
XX:SP500.30
was off 3.2%, while the Utilities Sector
XX:SP500.55
has dropped 10.6% over the same period.
See: U.S. stocks are facing a triple threat that could lead to more losses ahead
What has happened this year is a welcome change for the stock market, but it is a mirror image of 2022 as bear markets offer very few strong performers, so everything unravels at the same time, Colas said.
In a market downturn, investors would try to preserve capital by selling “essentially everything” to avoid further losses when macroeconomic conditions trump fundamentals of companies, he said.
Last year, every S&P 500 sector lost money on a total return basis except for Energy
XX:SP500.10
and Utilities sectors as runaway inflation forced the Federal Reserve to hike interest rates seven times a year in a campaign to get prices under control. The S&P 500 slumped 19.4% to suffer its worst year since the 2008 financial crisis.
U.S. stocks ended lower on Tuesday as investors looked ahead to the widely anticipated reading on August inflation from the consumer-price index on Wednesday morning. The S&P 500 lost 0.6% and the Nasdaq Composite
COMP
was off 1%, while the Dow Jones Industrial Average
DJIA
dropped less than 0.1%.
MarketWatch live coverage: Apple Event: New iPhone 15, Apple Watch announced


