
This post was originally published on this site
As investors look back after a brutal year for markets, many are asking themselves the same question: was there anything we could have done to sidestep a selloff that began early in the first quarter? As it turns out, the signs were there, according to Sam Stovall, chief investment strategist at CFRA Research.
By the end of February, markets were sending a clear signal that investors should brace for double-digit declines in 2022, Stovall said.
“A 2021 full-year gain for the S&P 500 in excess of 20%, followed by a decline in the first two months of the year, implied that a digestion of gains was underway and that the typical correction averaged 11%,” he said in a note to clients on Tuesday.
CFRA Research
Now, as a hoped-for “Santa Claus rally” has so far failed to materialize, Stovall is highlighting five “early indicators” for investors to watch out for over the next three months.
Based on historical returns, they could offer a hint at how the market might behave in 2023, a year for which macro strategists at some of the biggest investment banks and brokerages are anticipating modest gains for stocks.
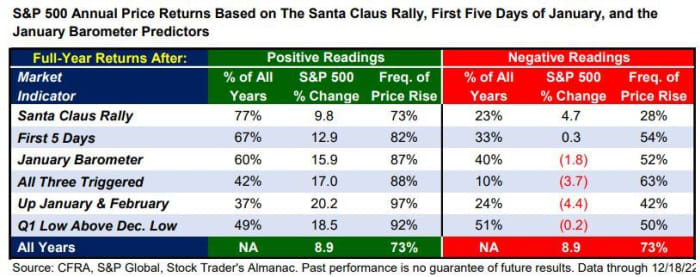
“Historically, five early indicators have offered fairly convincing directional clues for the coming calendar year: The ‘Santa Claus rally,’ the first five days of January, the January Barometer, an up January and February, and finally, if the first quarter’s low was above the prior December low,” Stovall said in the note.
The ‘Santa Claus rally’
As MarketWatch’s Vivien Chen reported over the weekend, history suggests that U.S. stocks typically finish higher during the “Santa Claus rally” period that encompasses the last five trading sessions of the year, plus the first two trading sessions of the new year. This year, the period began on Friday and will continue through Jan. 4, 2023.
According to an analysis of market returns going back to World War II conducted by Stovall, the strategist said a decline during the Santa Claus Rally period “pointed to both a below-average annual return of 4.7% and frequency of advance of 28% of the time.”
Of course, historical patterns don’t dictate future market performance, but it’s not exactly an encouraging market signal.
First five days
After the Santa Claus rally period ends, investors will focus next on the first five days of January, Stovall said.
“The S&P 500 rose in price during the first five days of the new year 67% of the time, resulting in an average annual gain of 12.9% and an 82% [frequency of advance]. A negative reading for the first five days resulted in a flat annual gain and an unimpressive 54% [frequency of advance],” he added.
‘January Barometer’
Like the first five days of January, the market’s performance for the month of January will also likely be the subject of intense interest.
“The old adage “As goes January, so goes the year,” is derived from this indicator, since a positive first month of the year, which happened 60% of the time, resulted in a full-year gain of 15.9% and an 87% [frequency of advance],” Stovall said.
All three triggered
If all three of the above-mentioned indicators are hit, investors could see huge gains.
“In this case, three is either a charm or may do harm. Since WWII, the S&P 500 was up in price during the Santa Claus Rally, first five days of January, and the entire month just 42% of the time,” Stovall said.
“But when it was, the S&P 500 rocketed higher by 17%, on average.”
Up January and February
Market returns in February have historically been lackluster. But during years where the S&P 500 advanced in both January and February, strong returns almost always followed.
When U.S. stocks rose during both months, “the S&P 500’s full-year return was
20.2% and its [frequency of advance] was 97% (missing 100% only because of 2011’s decline of 0.002%).”
Conversely, stocks fell on average 4.4% for the full year, and declined in price 58% of the time, when markets fell in both January and February.
What’s more, negative returns in January and February signaled “the start or continuation of bear markets in 1948, 1957, 1969, 1973, 1974, 2000, 2002, 2008, and 2022.”
Q1 low below December low
This one is pretty straightforward: if the low for the first quarter ends up being higher than the the low for the prior December, markets almost always advanced, producing an average annual return of 18.5%. This indicator has been trigged almost 50% of the time since World War II, Stovall said.
U.S. stocks are on track to record their largest annual losses since 2008 this year. Additionally, the major averages have kicked off an abbreviated final trading week mostly in the red, with the S&P 500
SPX,
and Nasdaq Composite
COMP,
lower, while the Dow Jones Industrial Average
DJIA,
clung to modest gains.
