
This post was originally published on this site
 Fed language is notoriously bland to (hopefully) prevent it from impacting the financial markets in any way. Benign language is absent in the latest meeting minutes. Consider the following (emphasis added):
-
After economic shutdowns started to occur on a widespread basis, initial claims for unemployment insurance benefits skyrocketed in the second half of March through the first half of April, a development that pointed to substantial job losses in April.
-
Spending for business equipment fell considerably in the first quarter, led by a sharp decrease in purchases of transportation equipment. Business investment in nonresidential structures also dropped notably.
-
Total industrial production fell precipitously in March, as the coronavirus outbreak led many factories to close late in the month.
-
Real exports declined sharply in the first quarter. However, imports declined at a much faster rate so that net exports made a sizable positive contribution to GDP growth.
-
The projection for the U.S. economy prepared by the staff for the April FOMC meeting was downgraded notably from the March meeting forecast in response to information on the spread of the coronavirus and the measures undertaken to contain it both at home and abroad. U.S. real GDP was forecast to plummet and the unemployment rate to soar in the second quarter of this year.
The Fed has probably decided that stark language is warranted due to the severity of the situation.
The Fed’s preferred coincidental indicator is the labor market. It has all but collapsed. Consider the following labor market spider charts courtesy of the Atlanta Fed. Let’s start with February: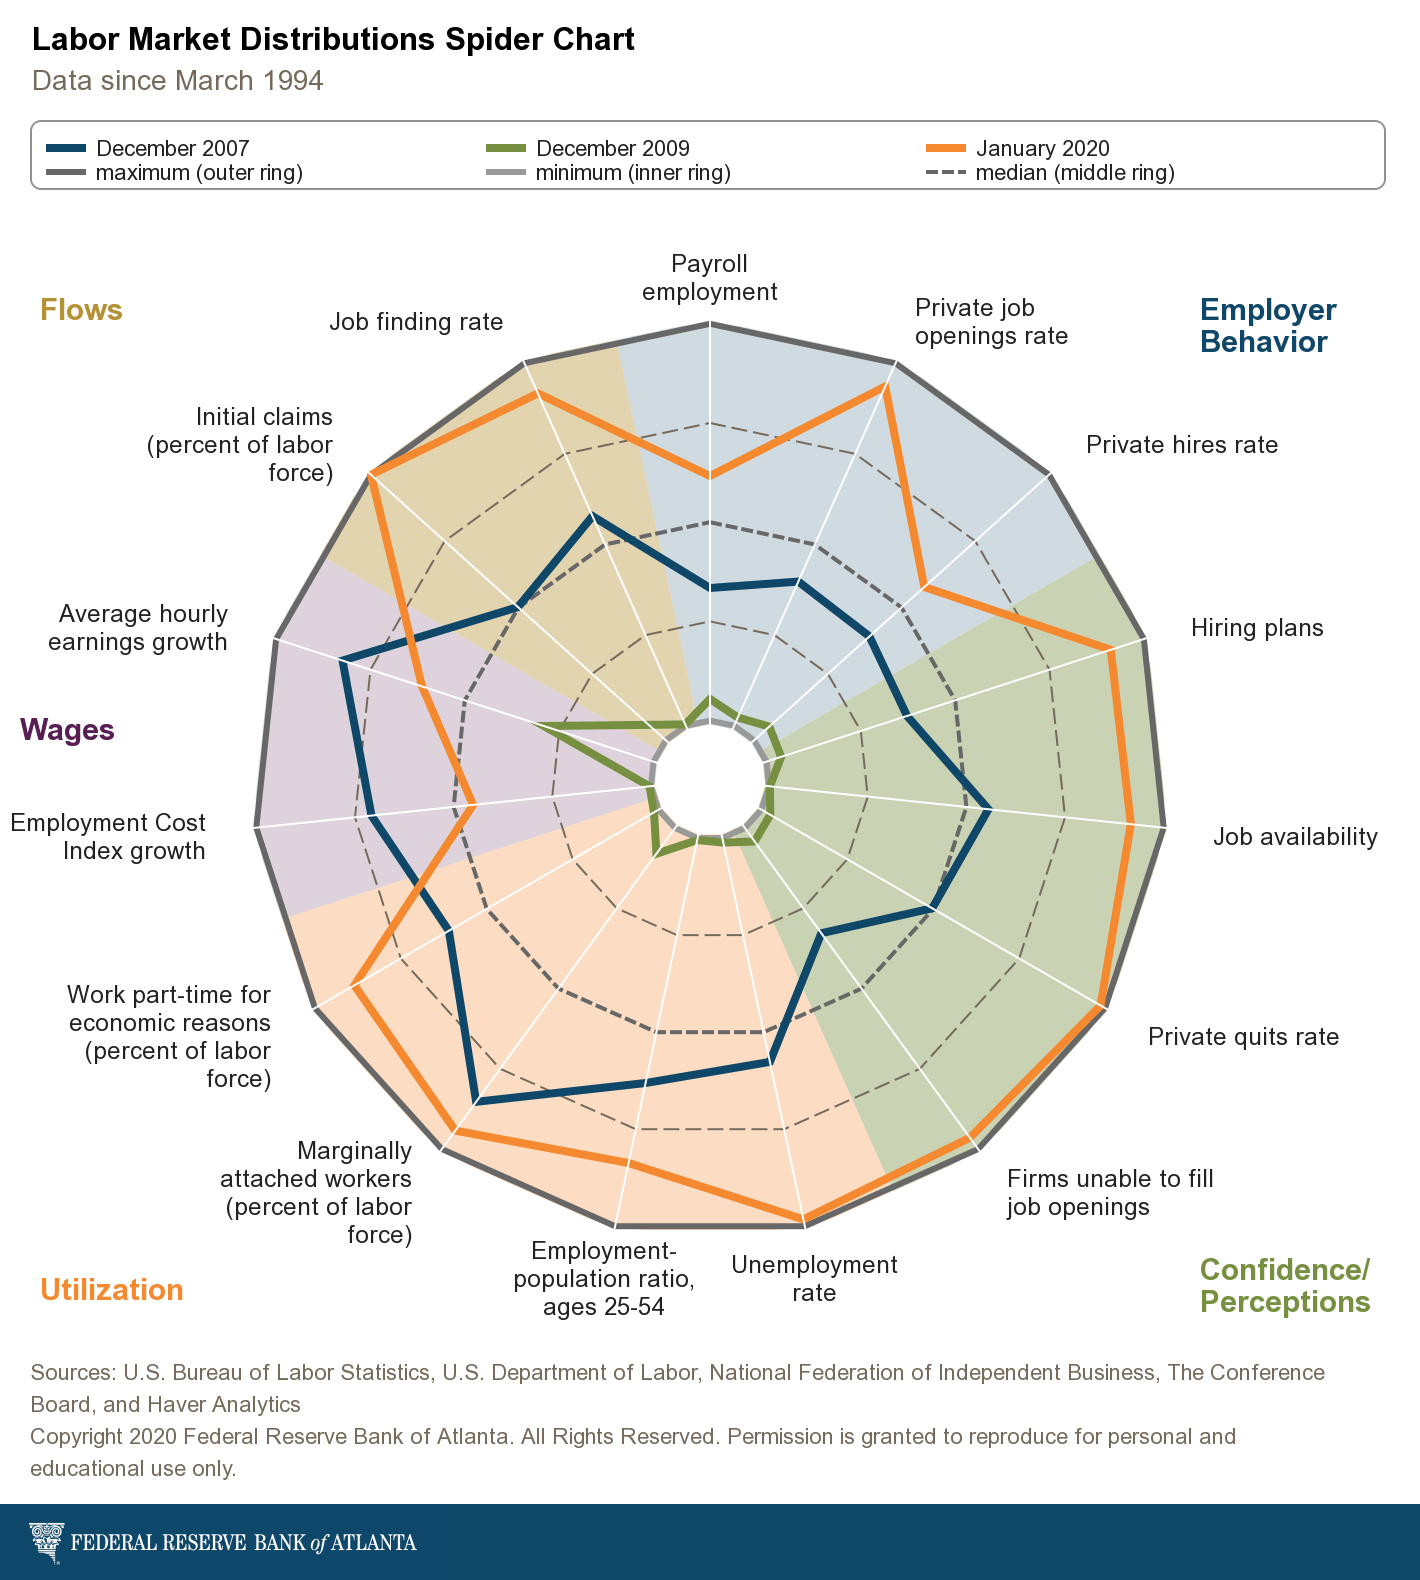 The blue line represents the peak from the preceding expansion while the gold line shows then-current data from a number of important labor market indicators. With the exception of wages, the then-current labor market was is good statistical shape; in some ways, the US labor market was in its best shape of the last 50 years.
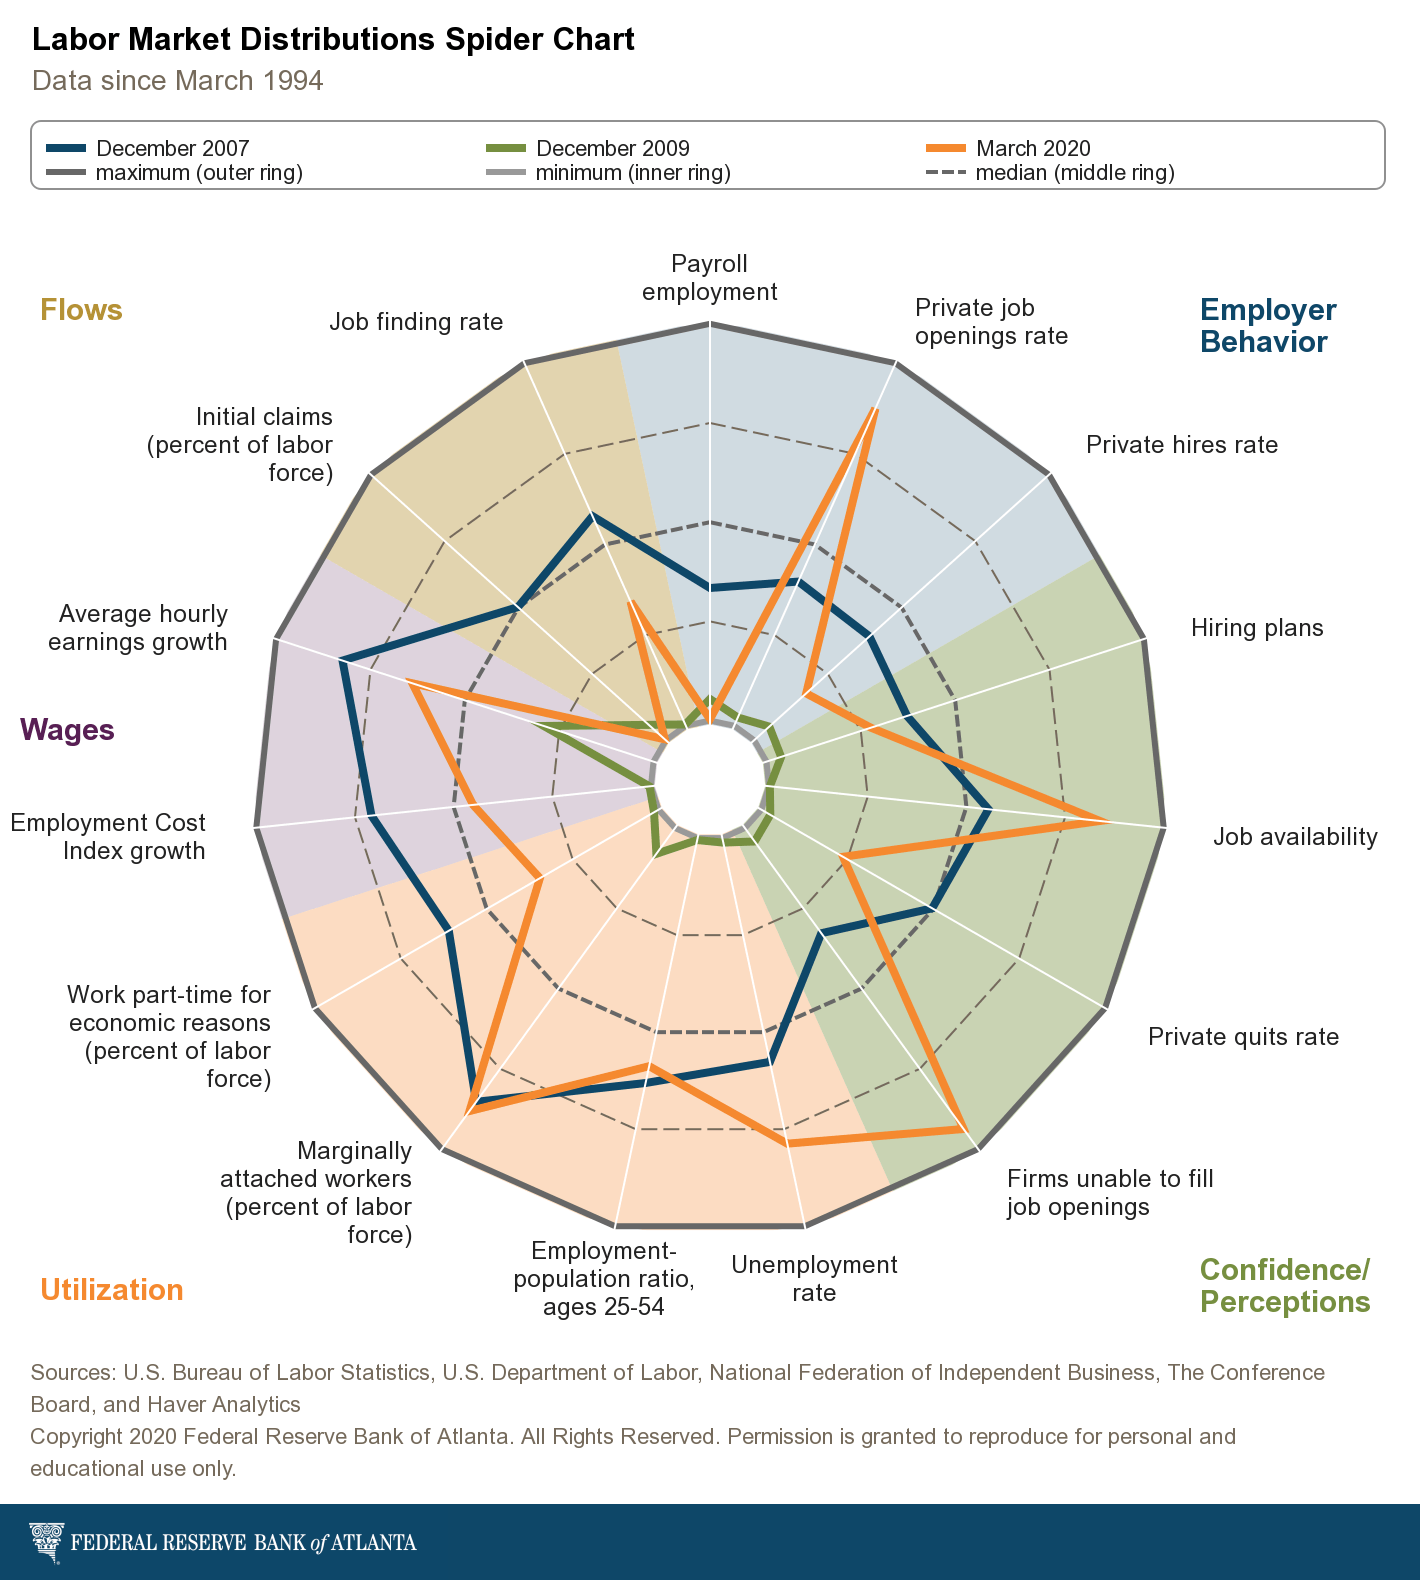 One month later — about 30 days — the market has started to contract severely. Payroll employment, job-finding rate, initial claims, and private quits are now below the best levels from the preceding expansion.
 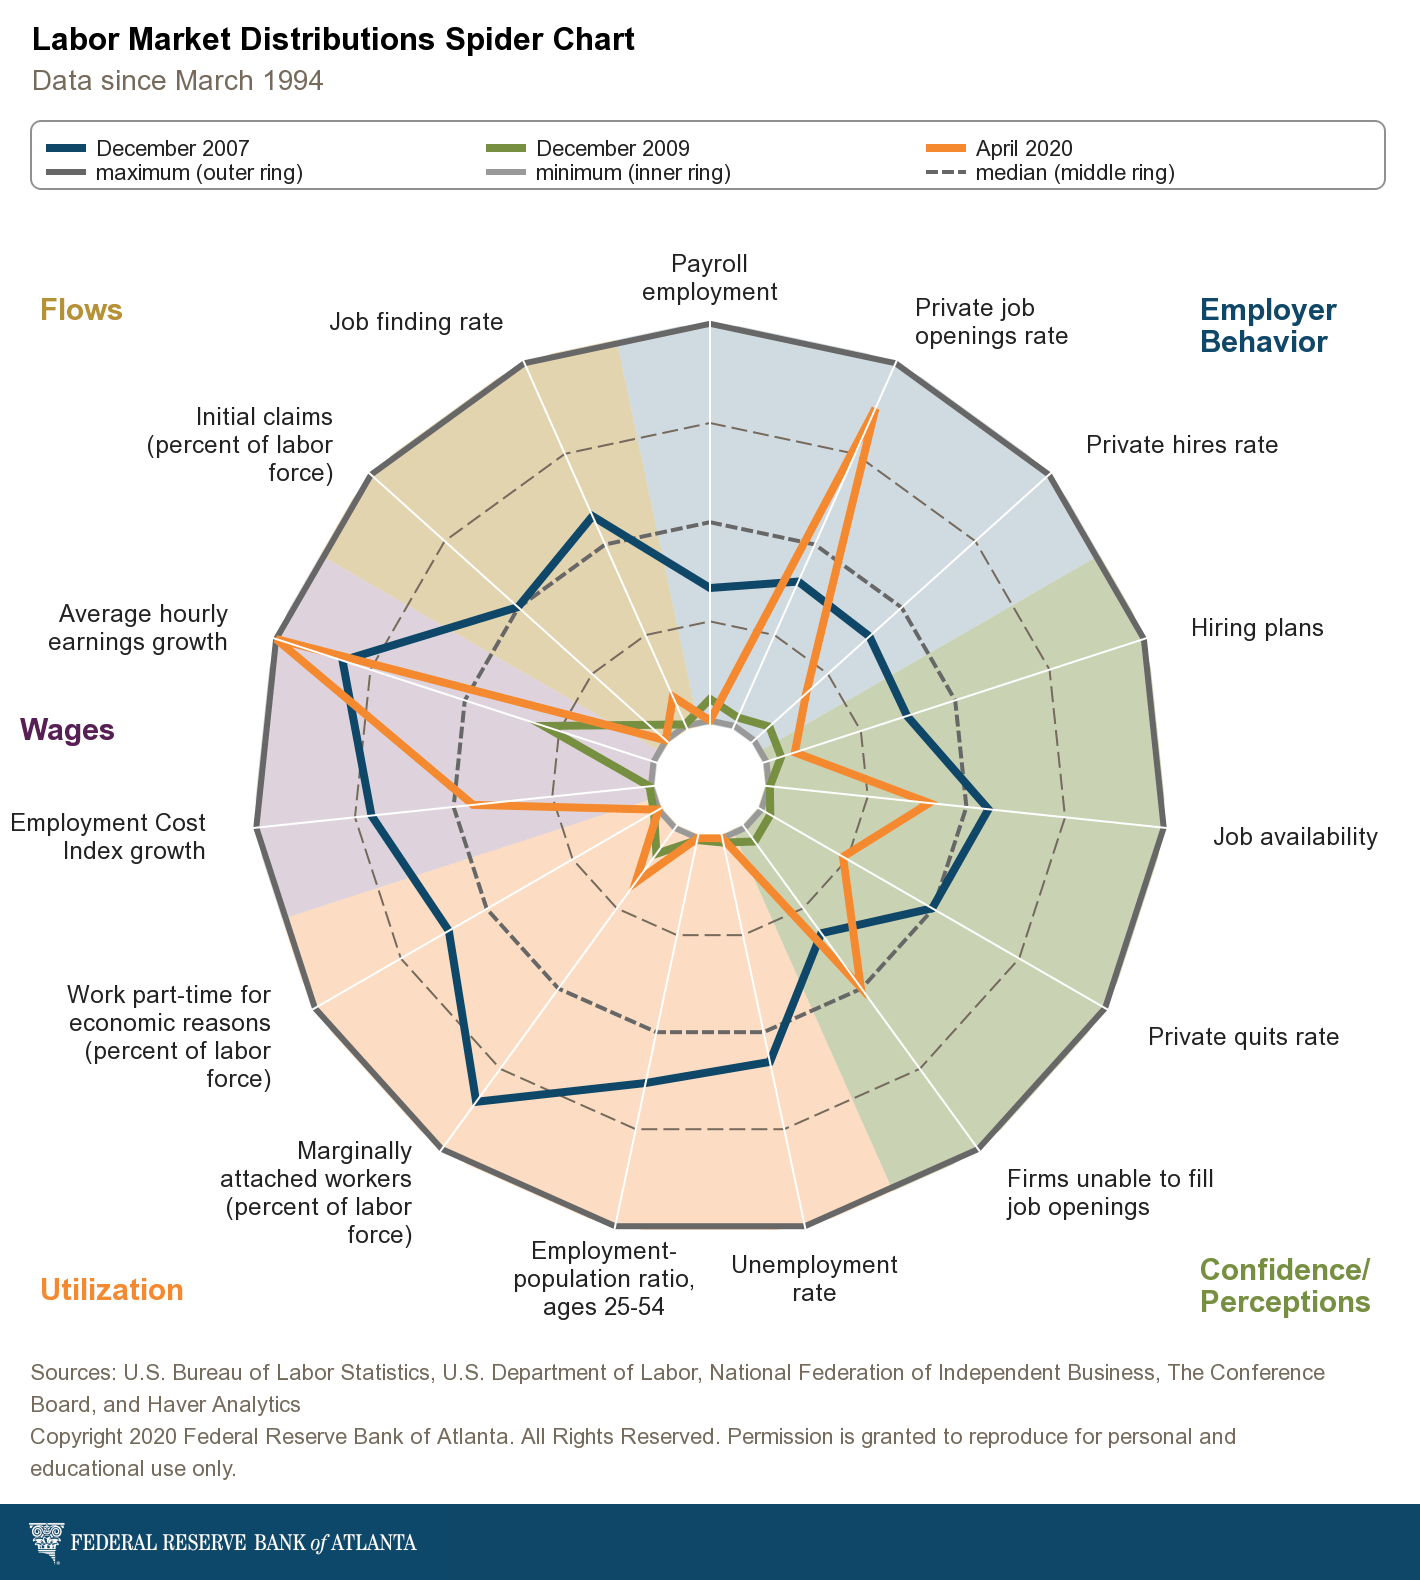 By April’s report, the market has all but collapsed.
Let’s look at a few other key pieces of data from the labor market, just to put this data into perspective: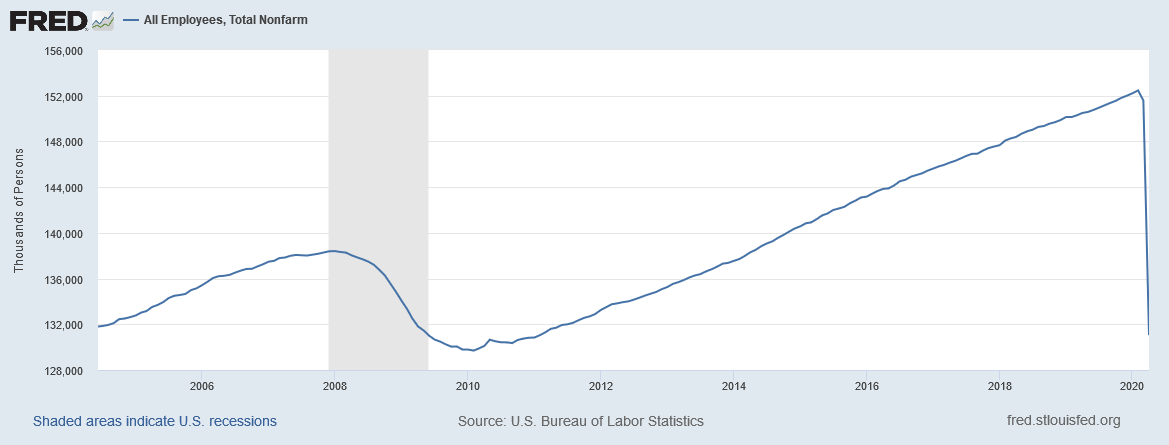 All establishment job gains have been all but wiped out.
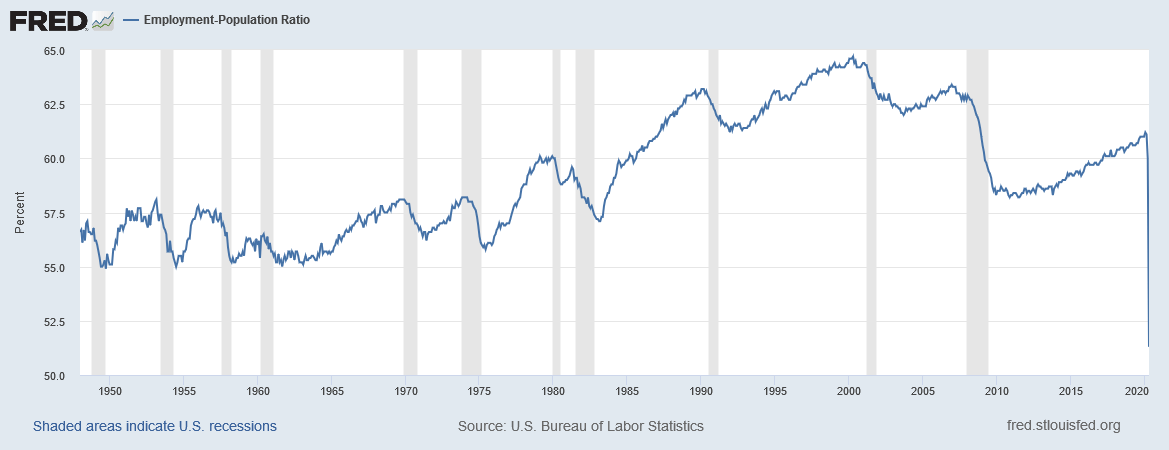 The employment/population ratio has cratered to its lowest level in the last 70 years.
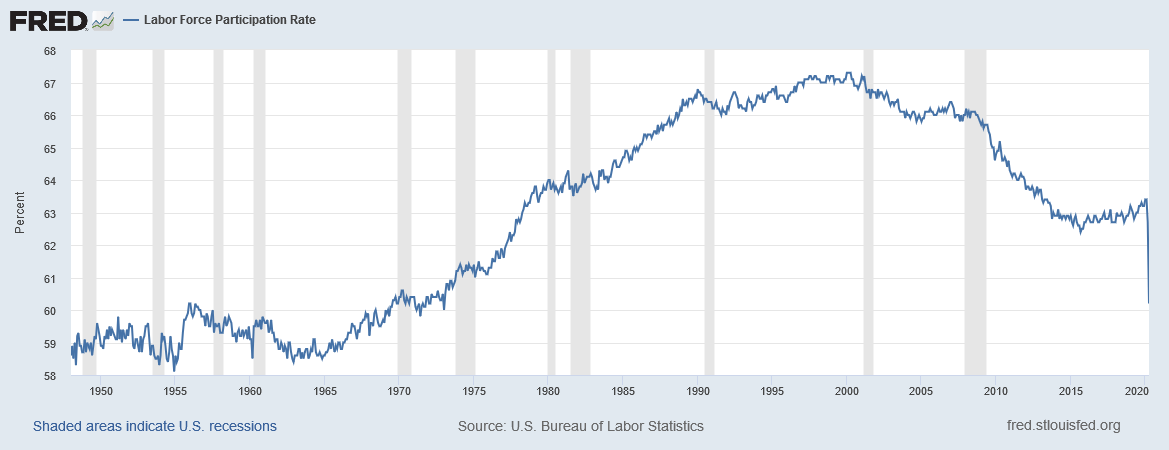 The labor force participation rate has also dropped sharply and is approaching levels from the 1960s.
I don’t have the vocabulary to adequately describe the speed at which the labor market has contracted. But there is no denying that the damage has been swift and severe.
Let’s take a look at this week’s performance table: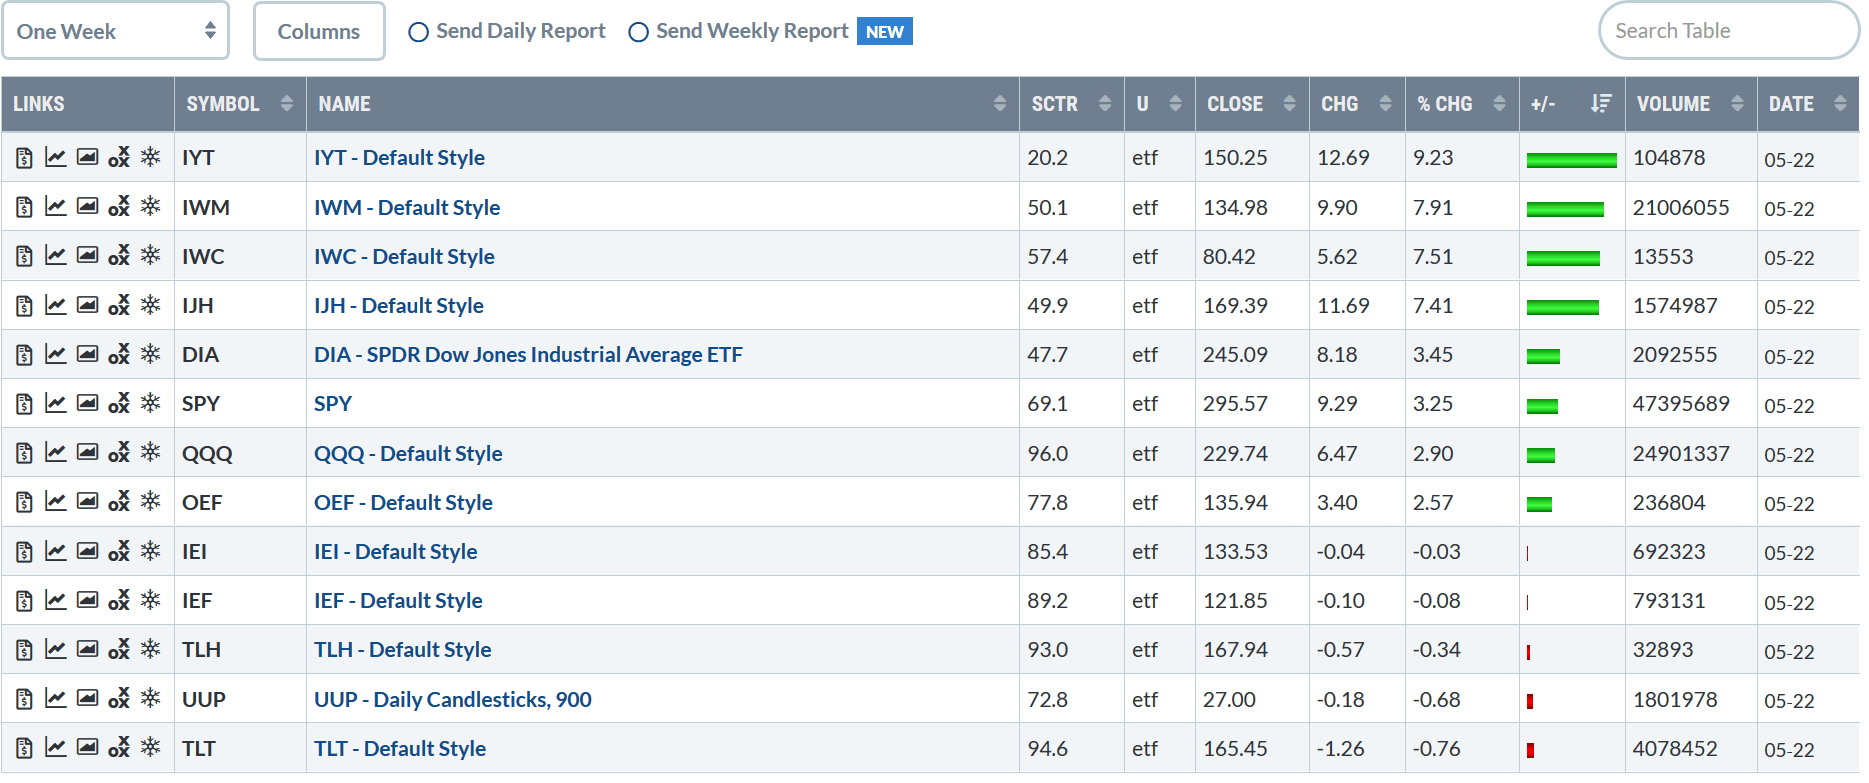
The above table is great for the bulls. Smaller-caps led the market higher and their gains were all over 7%. Larger-caps also made good advances. Once again, the Treasury market played spoiler: the long end of the curve was off only modestly.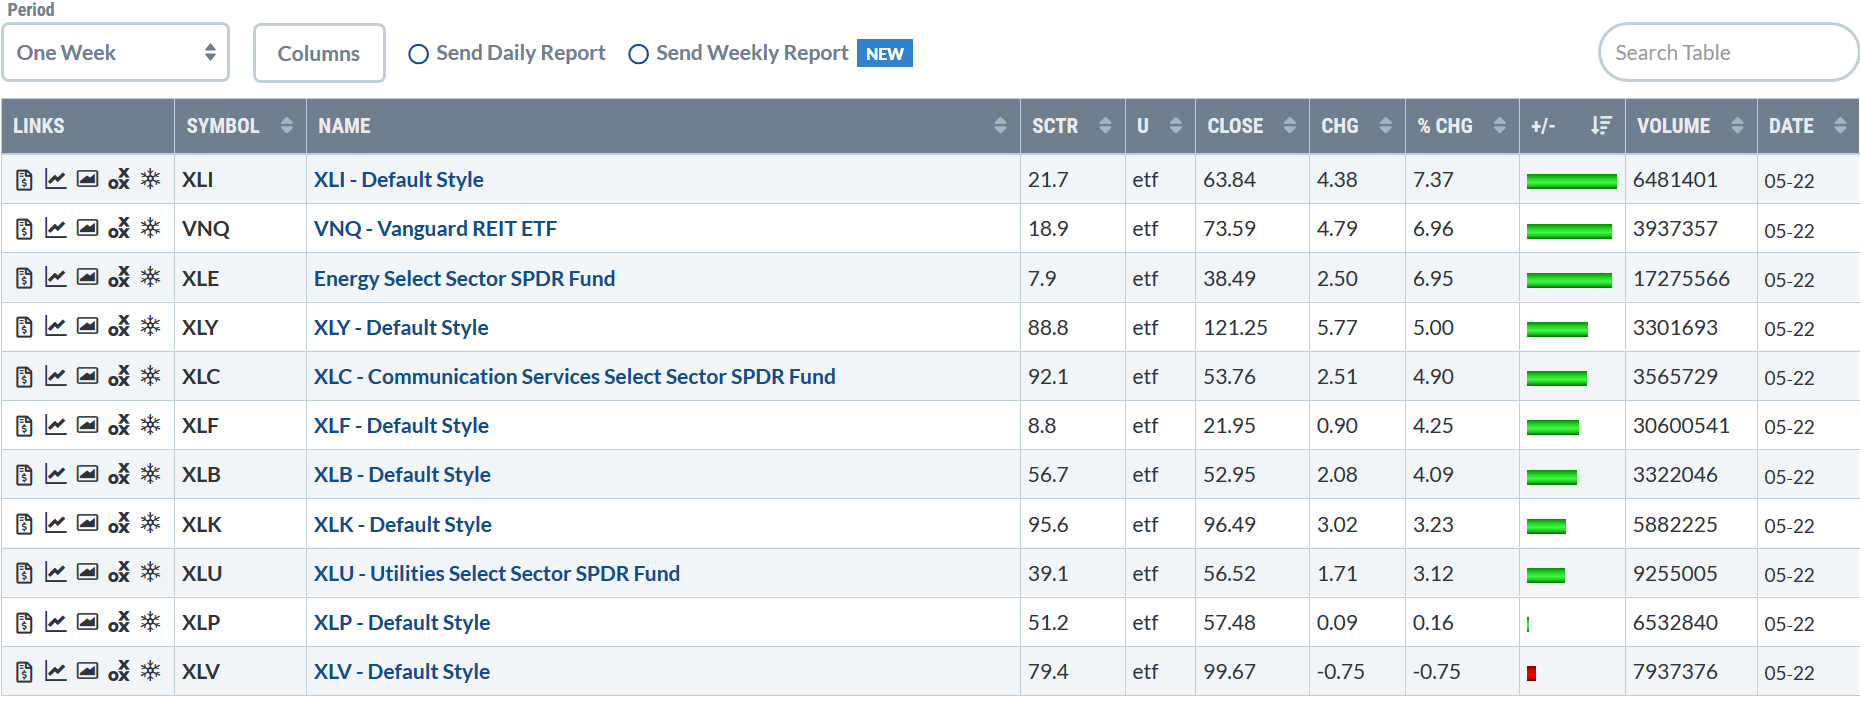 The key to this week’s sector performance table is at the bottom: defensive sectors were the bottom three performers. At the top are industrials, real estate, energy, and consumer discretionary — all sectors that have a bullish tint.
Let’s start with this week’s chart of the SPY: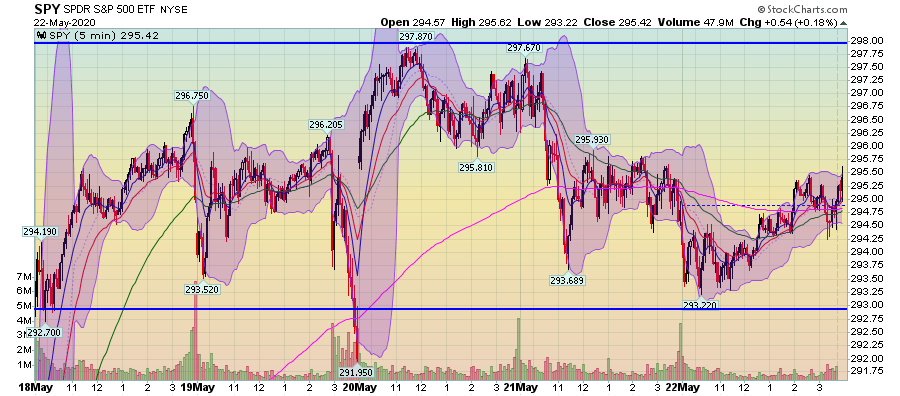 Despite posting a gain of slightly more than 3%; the SPY traded sideways for the week and only traded within a five-point range.
 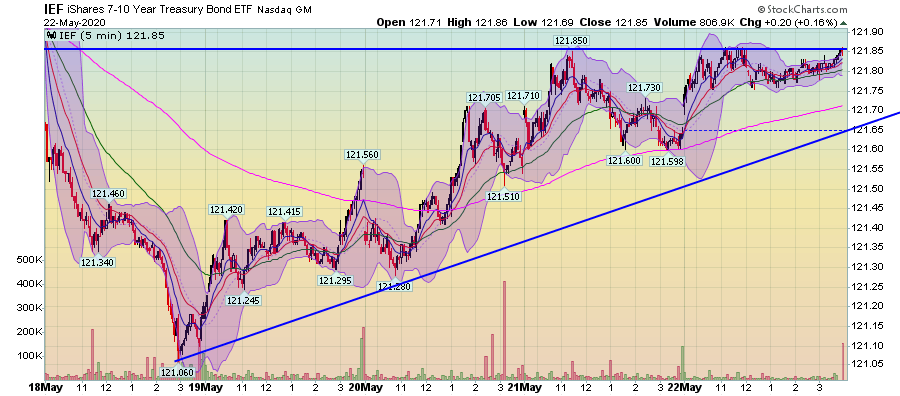 In contrast, the IEF spent the last four days of the week in a rally, allowing it to post a gain for the week.
Let’s pull the lens back to the 2-week SPY chart: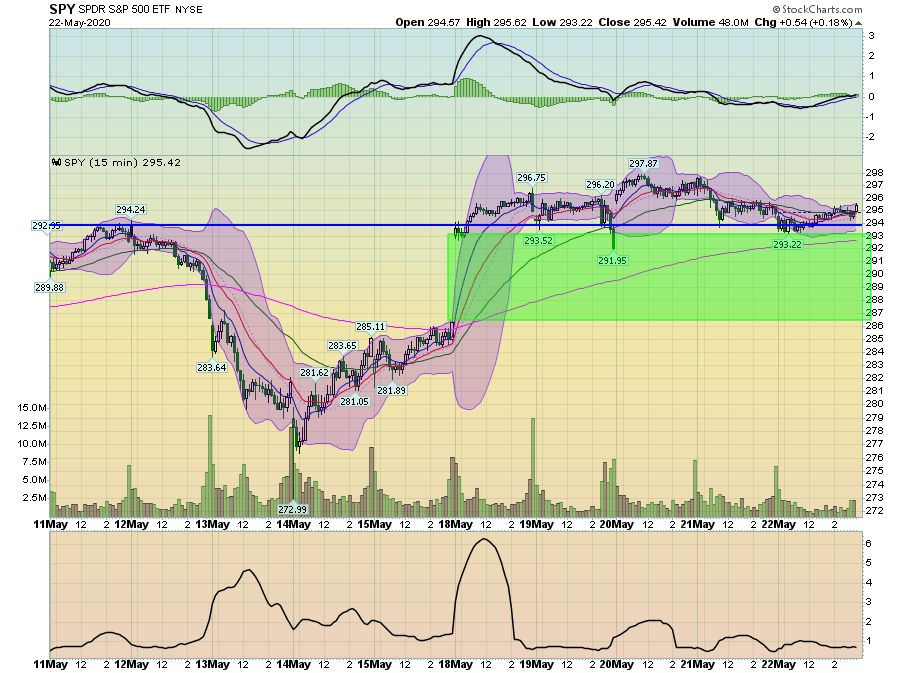 Most of the SPY’s gains occurred on Monday morning when the index gapped higher. Prices used the 295 level from last week for technical support.
Finally, we have the daily charts, starting with the SPY: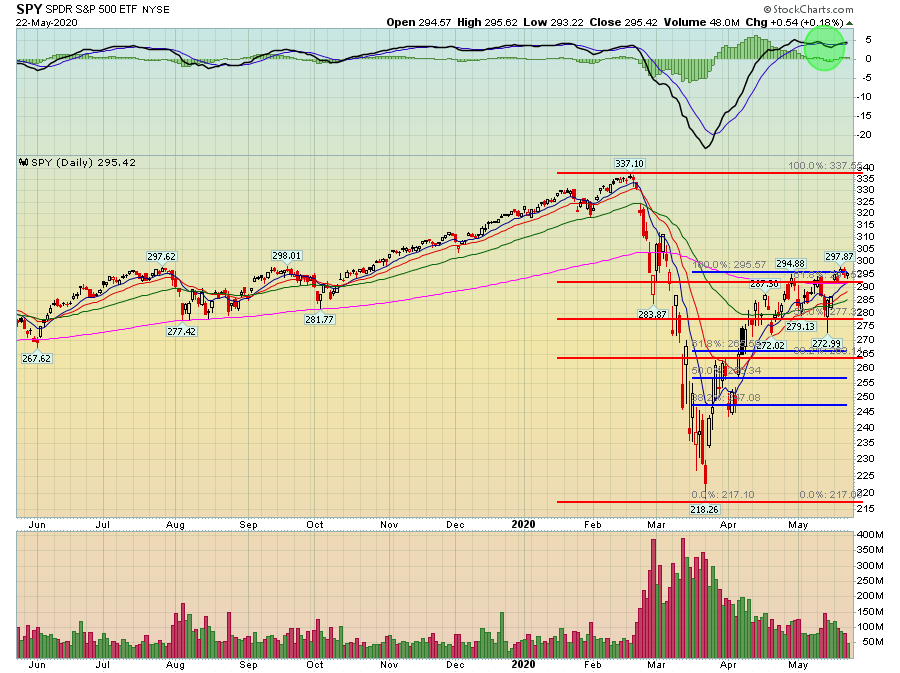 The SPY is still having a hard time making a meaningful move above its 200-day EMA. After gapping higher on Monday, prices couldn’t follow through. Notice the declining volume as well, indicating a lack of enthusiasm as the week wore on.
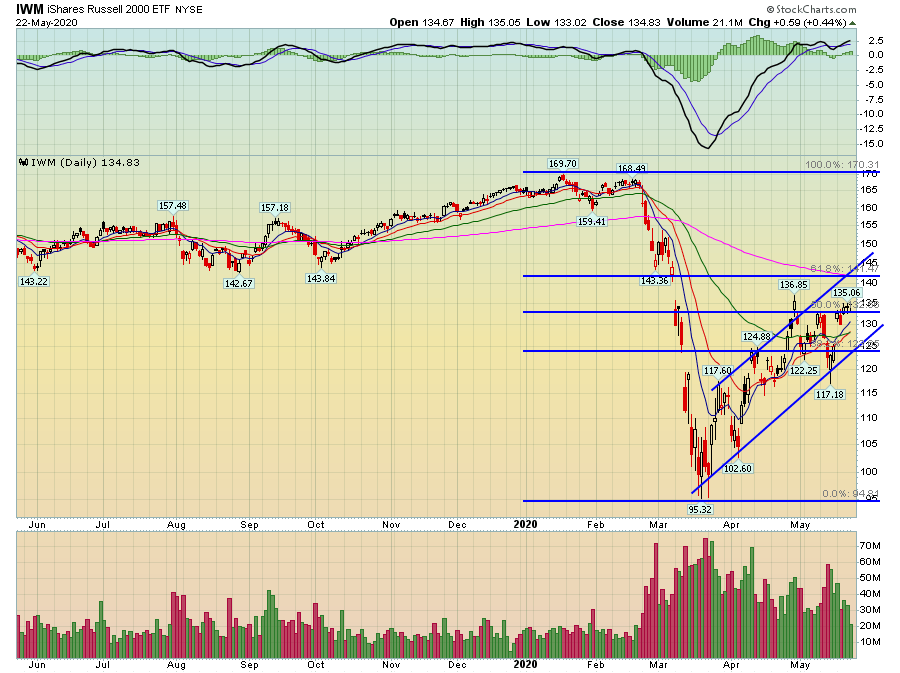 The IWM remains in an uptrend, although this week, like the SPY, prices have couldn’t make a strong move through resistance.
Right now, it feels like the markets want to pause. Both the IWM and SPY are at key fib levels and each has made a solid advance from the March lows. But there are a number of reasons for traders to be concerned as well: the economy is in a recession, restarting growth after lockdown will be difficult, and China-US tensions are ramping up again.
A pause seems appropriate. Unless, of course, there’s a major news event over the weekend like last week.
Disclosure: I/we have no positions in any stocks mentioned, and no plans to initiate any positions within the next 72 hours. I wrote this article myself, and it expresses my own opinions. I am not receiving compensation for it (other than from Seeking Alpha). I have no business relationship with any company whose stock is mentioned in this article.

