
This post was originally published on this site
Closing The Gap
Target Corp. (TGT) has come a long way since I last covered it in my July 2019 article, “Target – Room For More Than One Brick And Mortar Retailer“. The shares were trading at around $88 and a P/E of 15. This was a significant discount to Walmart (WMT) despite Target having a better return on capital and higher earnings and dividend growth rates. At the time, I noted the retailer’s capital investment program to make Target “America’s easiest place to shop”. These included moves to streamline online order pick-up from stores as well as purchasing Shipt to provide same-day home delivery of online orders.
Source: 2020 Financial Community Meeting Presentation – John Mulligan, COO
These moves paid off as the markets reacted well to Target’s Q2 and Q3 earnings releases, taking the stock up to $128 by the end of 2019. Fear of the COVID-19 pandemic caused the stock to give back almost all these gains by the end of March 2020, but it reversed again starting in April. Shares nearly reached the prior highs as the market began to anticipate Target’s ability to perform well during the pandemic and look forward to the recovery period. At those levels, Target had basically closed the valuation gap with Walmart.
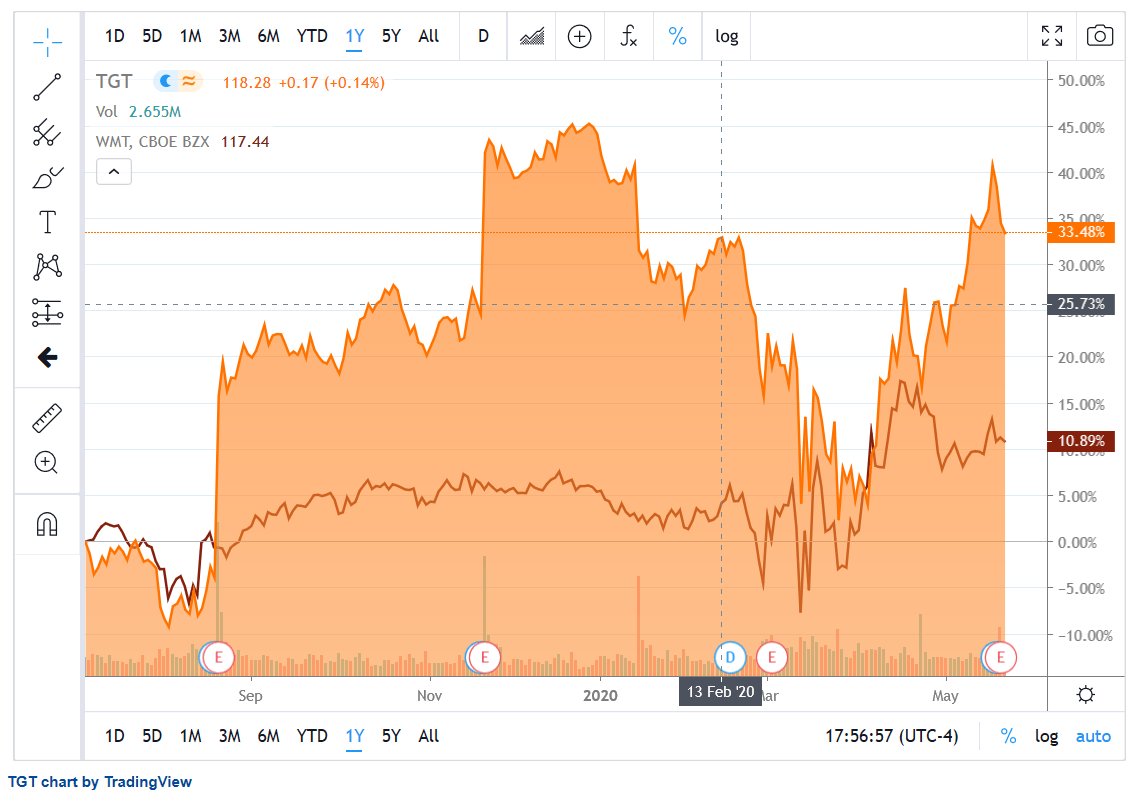
Source: Seeking Alpha TGT Chart Page
Target shares pulled back a little since reporting Q1 2020 earnings. While the retailer reported double-digit sales growth similar to other large chains that had already released Q1 earnings, there was disappointment in the operating margin which fell to 2.4% from 6.4% in Q1 2019. As a result, EPS fell to $0.57 from $1.54 in the prior year Q1. The key drivers of the margin decline were a write-down of apparel inventory, mix shift to lower-margin goods, and higher supply chain costs from the digital channel. I expect these cost pressures to reverse in future quarters, starting immediately with the absence of further inventory write-downs. Assuming this margin improvement, Target is similarly valued in the 24-25 forward P/E range along with Walmart. Target is positioned to perform well in the upcoming recovery, but it is no longer as attractively valued compared to peers. Target is safe to hold, but I would wait for more pullback before buying.
Margins Should Recover
Considering the run-up, it was not surprising to see some pullback when Target reported Q1 2020 earnings on May 20. Total sales grew by 11.3% and comparable sales grew 10.8%. This was similar to other big-box chains that remained open through the pandemic, including Walmart, Home Depot (HD), and Lowe’s (LOW). Target really stood out in the digital channel, as store-originated comp sales made up just 0.9% of the growth while digitally-originated made up the remaining 9.9% of the total growth. Looking at digital sales by themselves, they were up 141% with strengthening growth each month of the quarter.
The disappointment seems to be with the operating margin, which was only 2.4%, compared to 6.4% in Q1 2019. SG&A was not a problem, even though Target increased employee compensation during the pandemic. SG&A expense grew in-line with revenue resulting in almost no change as a percentage of sales. The main driver of lower margin was in cost of goods sold. On the earnings call, the CFO listed three key components of the higher costs. The biggest was a write-down of inventory, mainly in Apparel, which saw a sales decline at the beginning of the quarter as customers shifted to categories like Food & Beverage and Essentials. The CFO pegged these costs as “hundreds of millions of dollars” which I estimate to be 150-200 basis points of the overall 400 bp margin decline. The second driver of the lower margin was category sales mix. The three lowest margin categories, Hardlines, Essentials, and Food & Beverages all saw comp sales increases in the high teens or better. The two highest margin categories had sales declines, with Home down high single digits and Apparel down more than 20%. The shift in mix lowered margins by another 150 basis points. Finally, digital fulfillment and supply chain costs were the third main reason for lower operating margin.
Most of these cost pressures should prove temporary. The apparel inventory write-down looks like a one-time event as the onset of lockdowns in March changed category demand in unprecedented ways. Food & Beverage and Apparel both had high single-digit comps in February. In March, sales shot up over 50% in Food & Beverage and were down more than 50% in Apparel. By the end of April, both categories were growing again. The COO noted on the call that with sales moving back to more normal trends, the merchandising teams are in a better position to manage inventory. The bigger inventory risk going forward appears to be stock-outs due to high demand, especially on imported items like Electronics. While this could be a small headwind to sales growth in the short term, write-downs seem unlikely.
The category mix shift could also continue to be a headwind to margins for a short time, but as noted previously, many categories were already moving back to historical trends by late April. The higher cost of digital order fulfillment may continue to impact margin percentages, but the company sees this as an investment in customer loyalty which will increase market share and net profits even if margin percentages are impacted.
The first is, for the vast majority of those digital transactions and especially the ones where the guests taking advantage of our same-day services, the sales dollars, the market share dollars, and the variable profit dollars from those sales are definitely a good thing.
And second, and this is most important, the economics of a digital transaction, as I’ve said before, are so much bigger than just the single transaction. When we see guests engage with more of our fulfillment choices, they become stronger customers of Target and we build relevance with them in total. And that’s where the economics of digital get most powerful.
As I referenced in the Financial Community Meeting discussions a few months ago, when we see a guest use Drive-Up for the first time, they spend more at Target in total and even more in store than they did previously. And so, there’s a powerful accelerant of guests becoming stronger users of all of our services, and we had 2 million guests use Drive-Up for the first time in this quarter. And so, the long run prospects of that digital growth in terms of what it means with relevancy to our guests, I think are very powerful.
Source: CFO Michael Fiddelke, Target Q1 2020 Earnings Call
Below, I compare Q1 2020 and 2019 components of operating margin for Target and Walmart. Target was clearly superior a year ago with a 6.4% operating margin vs. 4.0% at Walmart. Walmart’s category mix leaning more toward low-margin Food & Beverage probably drove the difference. It also explains how Walmart was able to avoid a big decline in margin during the pandemic. That makes Target’s margin decline look even worse by comparison, but as discussed above, this should be temporary. I estimate the inventory write down to be about $300 million. Adding this back would get Target’s operating margin even with Walmart’s at 3.9%. That is reasonable since the shift in category mix at Target grew to look more like Walmart’s in Q1. I expect the mix to gradually shift back to normal for Target, which would result in Target once again beating Walmart on operating margin.
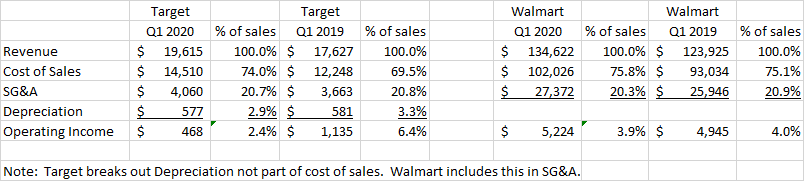
Data Source: Target and Walmart Q1 2020 Earnings Releases
Relative Valuation
The valuation discount Target had compared to Walmart has closed considerably since I last wrote about it in July. Target’s P/E on both a trailing 12-month and a forward estimate basis is now within 1-2 points of Walmart and also more in line with the S&P average. Target improved more than Walmart on a Price to Free Cash Flow basis, however. Both companies had large working capital releases from lower inventory in Q1 2020 but Walmart also had a large cash outflow to pay down accrued liabilities.
| Target vs. Walmart Comparison | |||||
| Market Cap | P/E | P/E | P/S | P/FCF | |
| $ billion | (TTM) | (FWD) | (TTM) | (TTM) | |
| TGT | $59.81 | 21.59 | 24.06 | 0.75 | 12.1 |
| WMT | $355.49 | 23.26 | 24.98 | 0.66 | 19.3 |
On the profitability metrics, the two companies are now closer in terms of return on assets and return on common equity, but Target is still the superior performer.
| Target vs. Walmart Profitability Ratios (TTM) | |||
| Return on Assets | Return on Total Capital | Return on Common Equity | |
| TGT | 7.03% | 11.69% | 28.27% |
| WMT | 5.89% | 9.17% | 18.86% |
Data Source: Seeking Alpha Peer Comparison Page
Finally, Target still has a superior dividend yield at 2.22% vs. 1.72% for Walmart, although that gap has narrowed as well.
Conclusion
Target showed strong sales growth in Q1 like many other big-box retailers that stayed open during the pandemic, including Walmart. The company was able to leverage its recent investments in the digital sales channel to drive this growth. While earnings declined vs. last year due to an inventory write-down and a shift to lower-margin categories, these hits to gross margin should not be as significant moving forward.
I expect Target to benefit from its experience growing the digital channel during the pandemic by expanding its customer base and capturing additional market share. This will translate to the bottom line as category mix and margins return to more normal levels. Target’s share price has appreciated considerably since I last reviewed it in July 2019. The company’s valuation is now more in line with Walmart and the overall market. Target remains a great company to hold for the long term, but I would wait for cheaper valuation levels to buy more.
Disclosure: I am/we are long TGT. I wrote this article myself, and it expresses my own opinions. I am not receiving compensation for it (other than from Seeking Alpha). I have no business relationship with any company whose stock is mentioned in this article.


