
This post was originally published on this site
There’s something comforting about Warren Buffett having had a very good year.
It means that the old rules haven’t been completely upended. Timeless truths that had been dismissed as being hopelessly old-fashioned—such as slow and steady win the race—are discovered to still contain wisdom after all.
A year ago, you may recall, many were ready to declare that those rules and truths no longer applied, and that Buffett was a has-been. His company Berkshire Hathaway
BRK.A,
BRK.B,
was behind the S&P 500
SPX,
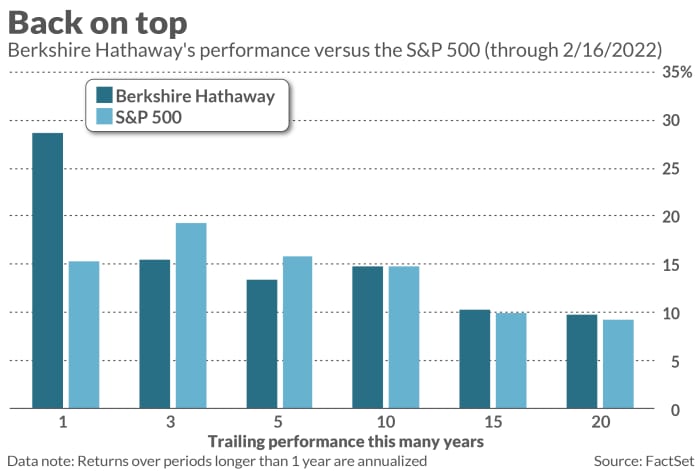
for performance over not just the trailing year but the trailing 10- and 15-year periods as well. One famous day trader declared that Buffett was all “washed up.”
He is probably getting the last laugh now. For performance over the last 12 months, Berkshire Hathaway is more than 15 percentage points ahead of the S&P 500. This is enough to put him ahead of the market for trailing 10- and 15-year returns as well, as you can see from the accompanying chart.
If that’s evidence of being “washed up,” please let me be washed, up too.
The occasion for these reflections is the imminent publication of Warren Buffett’s annual letter to shareholders, one of the most widely read on Wall Street. Past years’ letters typically have been published when Berkshire Hathaway reports its calendar-year earnings, and this year that’s scheduled for Feb. 26. In response to my inquiry, the company declined to say when this year’s letter would be released.
There’s no way of knowing whether Buffett will address his company’s emerging from its long drought of market-lagging performance, or draw any investment lessons from the experience. But the lesson I think is most important is that performance over shorter-term periods—including as long as several years—is largely a matter of luck, and that we therefore shouldn’t be making any investment decisions based on it.
This lesson is difficult for us to take to heart, because our investment horizon is a lot shorter from a psychological point of view than it is from a statistical perspective. Take a five-year holding period, for example. Most of us would have serious difficulty sitting on our hands with a strategy that lost money over that many years, and yet it’s entirely possible that a strategy that beats the market over the long term will—due to bad luck alone—lag over a five-year period.
To show this, I conducted the following Monte Carlo simulation: What if, in each of the next five calendar years, Buffett’s alpha (return relative to the S&P 500) would be picked at random from his actual alphas over the last 57 years? And what if I reran this experiment 10,000 times?
In 15% of these simulations, it turned out, Buffett’s hypothetical five-year return was negative.
To be sure, the odds of a negative alpha go down the longer the holding period. But you have to wait a lot longer before the odds of underperforming the market fall below 5%, the threshold often used to determine if something is statistically significant. In my Monte Carlo simulations, this required holding period was 13 years, believe it or not.
This is why, a year ago, I wrote that Buffett’s lengthy period of lagging the market was likely caused largely by just bad luck—and that we should give him “the benefit of the doubt.” So it’s not Monday-morning quarterbacking for me to now say we shouldn’t have been surprised that he’s had such a good year.
The broader investment lesson: If we want to base our investment decisions on rigorous statistics rather than how we feel, we need to be focusing on performance over periods of many years.
Anything shorter is probably just noise.
Mark Hulbert is a regular contributor to MarketWatch. His Hulbert Ratings tracks investment newsletters that pay a flat fee to be audited. He can be reached at mark@hulbertratings.com.
