
This post was originally published on this site
In this article, we examine the significant order flow and market structure developments driving NG’s price action.
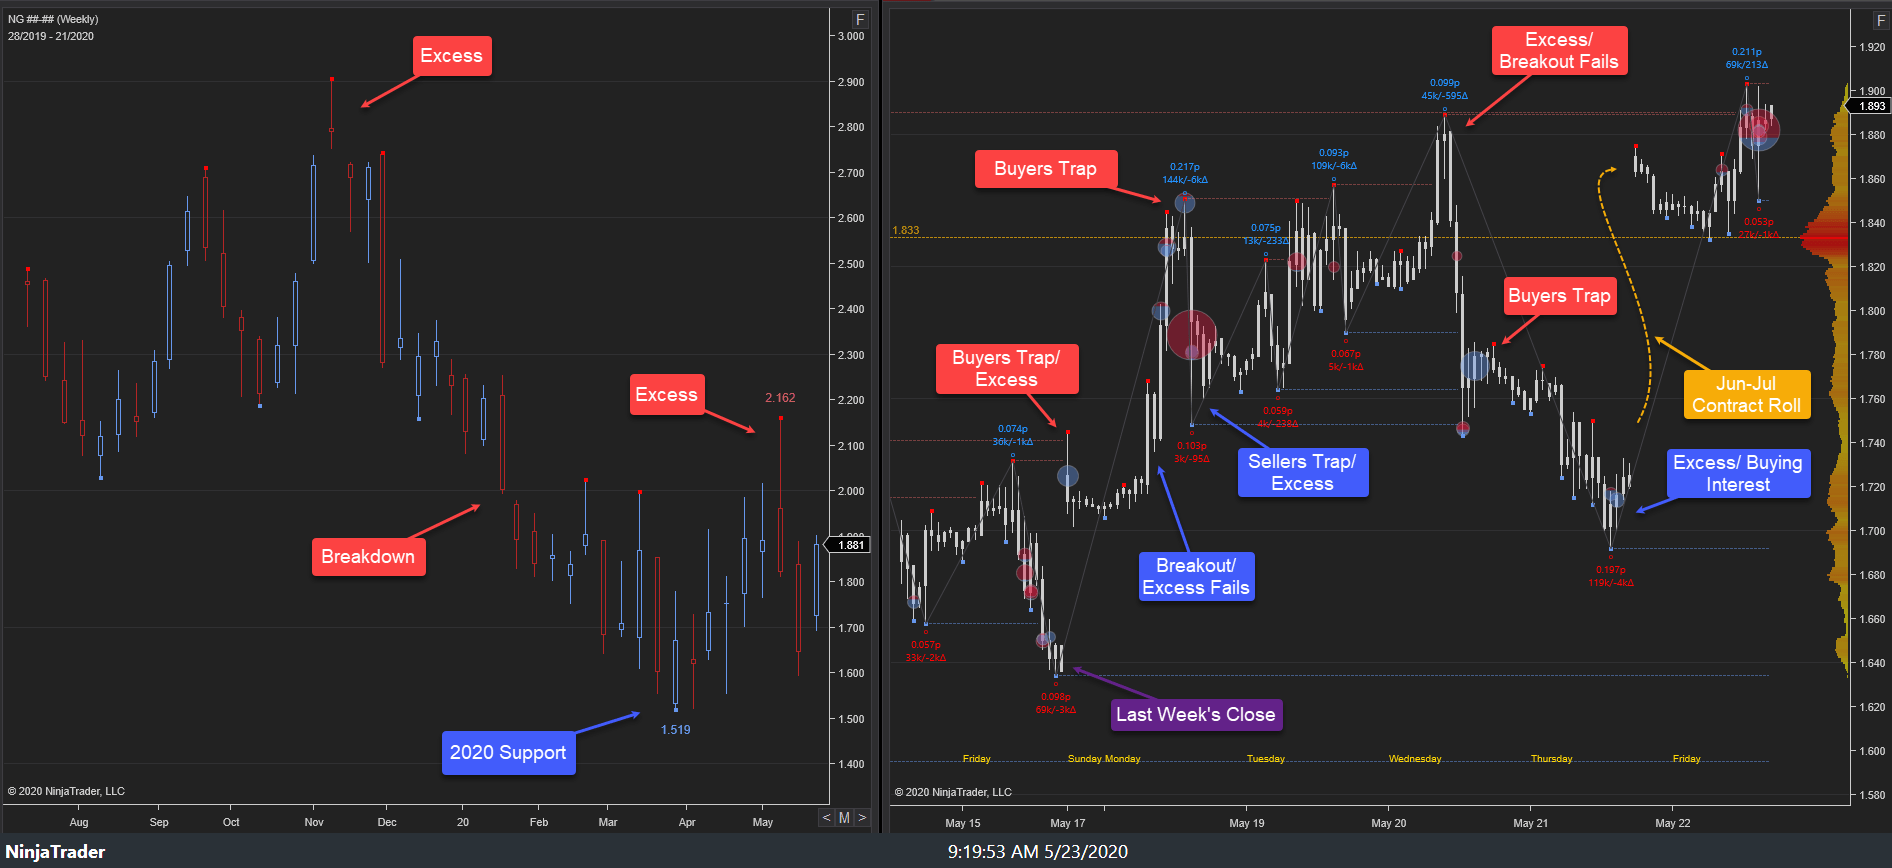
As noted in last week’s NG Weekly, the highest probability path for this week was buy-side barring failure of 1.59s as support. This probability path played out as a rally ensued in Monday’s trade, driving price higher to 1.85s into Tuesday’s auction. A minor probe higher developed to 1.89s in Wednesday’s auction where selling emerged within key supply overhead. A pullback ensued to 1.69s as liquidity shifted amidst the June-July contract roll. Re-pricing higher to 1.90s developed into Friday’s auction, settling at 1.88s.
18-22 May 2020:
This week’s auction saw a rally ensue in Monday’s trade as buying interest drove price higher to 1.85s. Buying interest emerged there into Monday’s NY close. Monday’s late buyers failed to hold the auction as a minor pullback and balance developed, 1.74s-1.85s, into Tuesday’s NY close.
Tuesday’s sellers failed to hold the auction as a minor probe higher developed in Wednesday’s trade, achieving the weekly stopping point high, 1.88s, within last week’s key supply overhead. Sell excess developed there, halting the rally phase. A pullback then ensued to 1.74s where buying interest emerged into Wednesday’s NY close. Wednesday’s late buyers failed to hold the auction as the pullback continued in Thursday’s trade to 1.69s through the EIA release (+81 bcf v +83 bcf expected). Buying interest emerged ahead of Thursday’s NY close as the liquidity roll from the June to July contract completed. A re-pricing developed to 1.90s early in Friday’s trade as buy-side breakout attempt above key resistance developed ahead of Friday’s close, settling 1.88s.
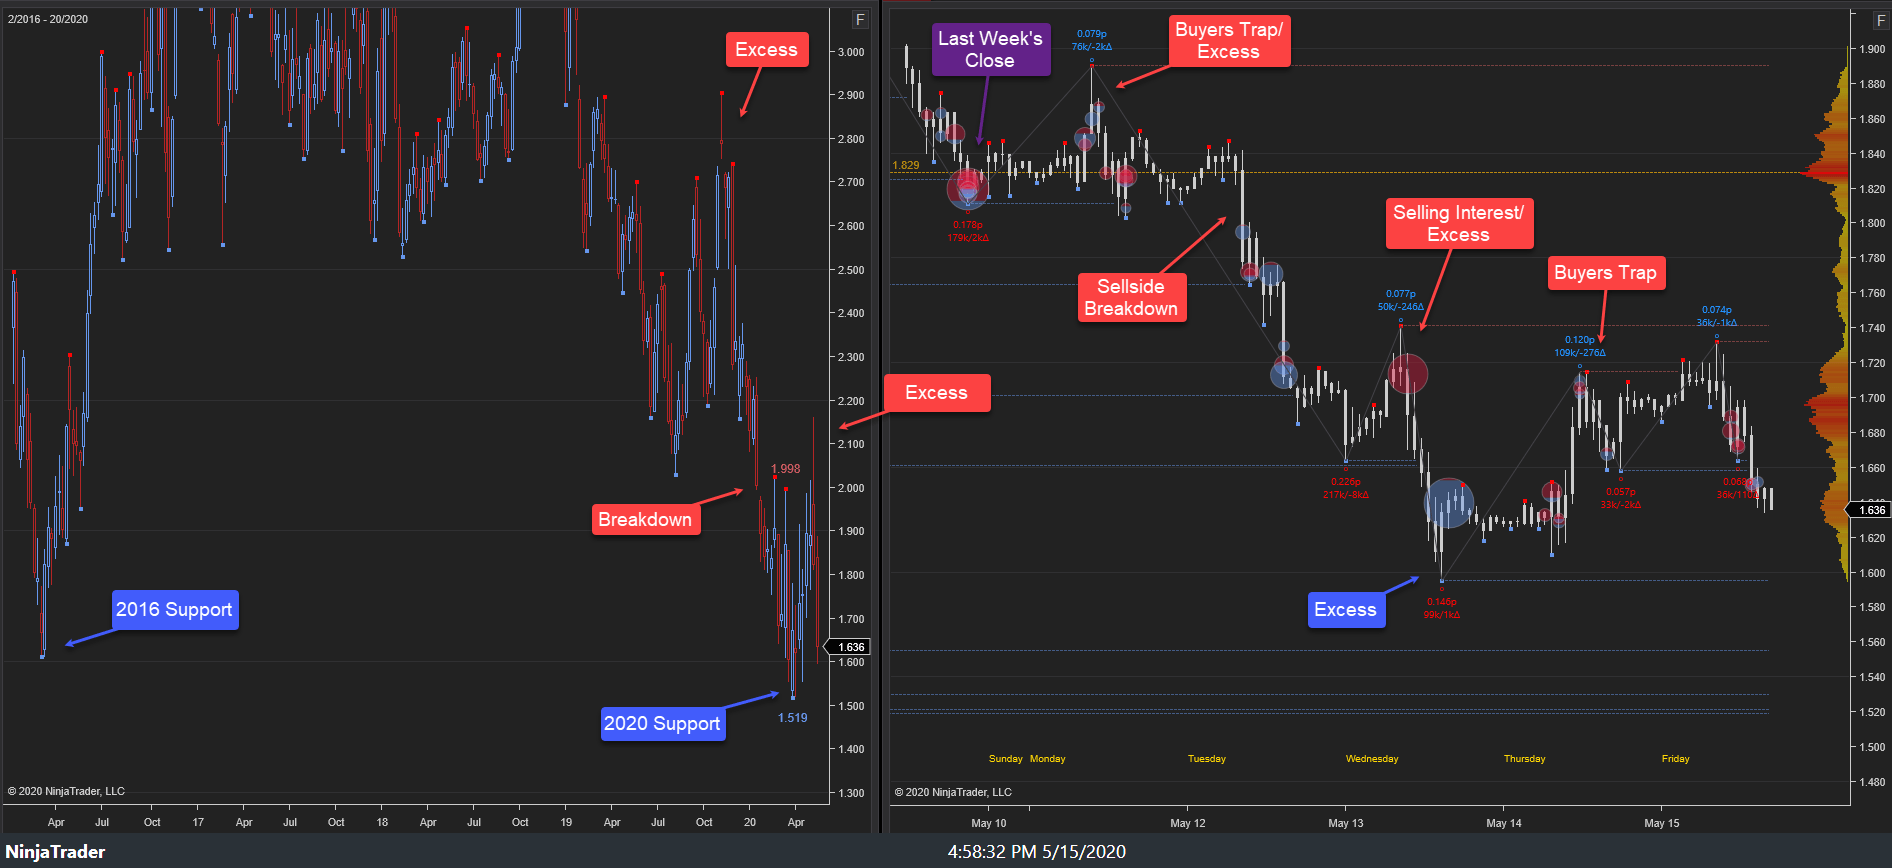
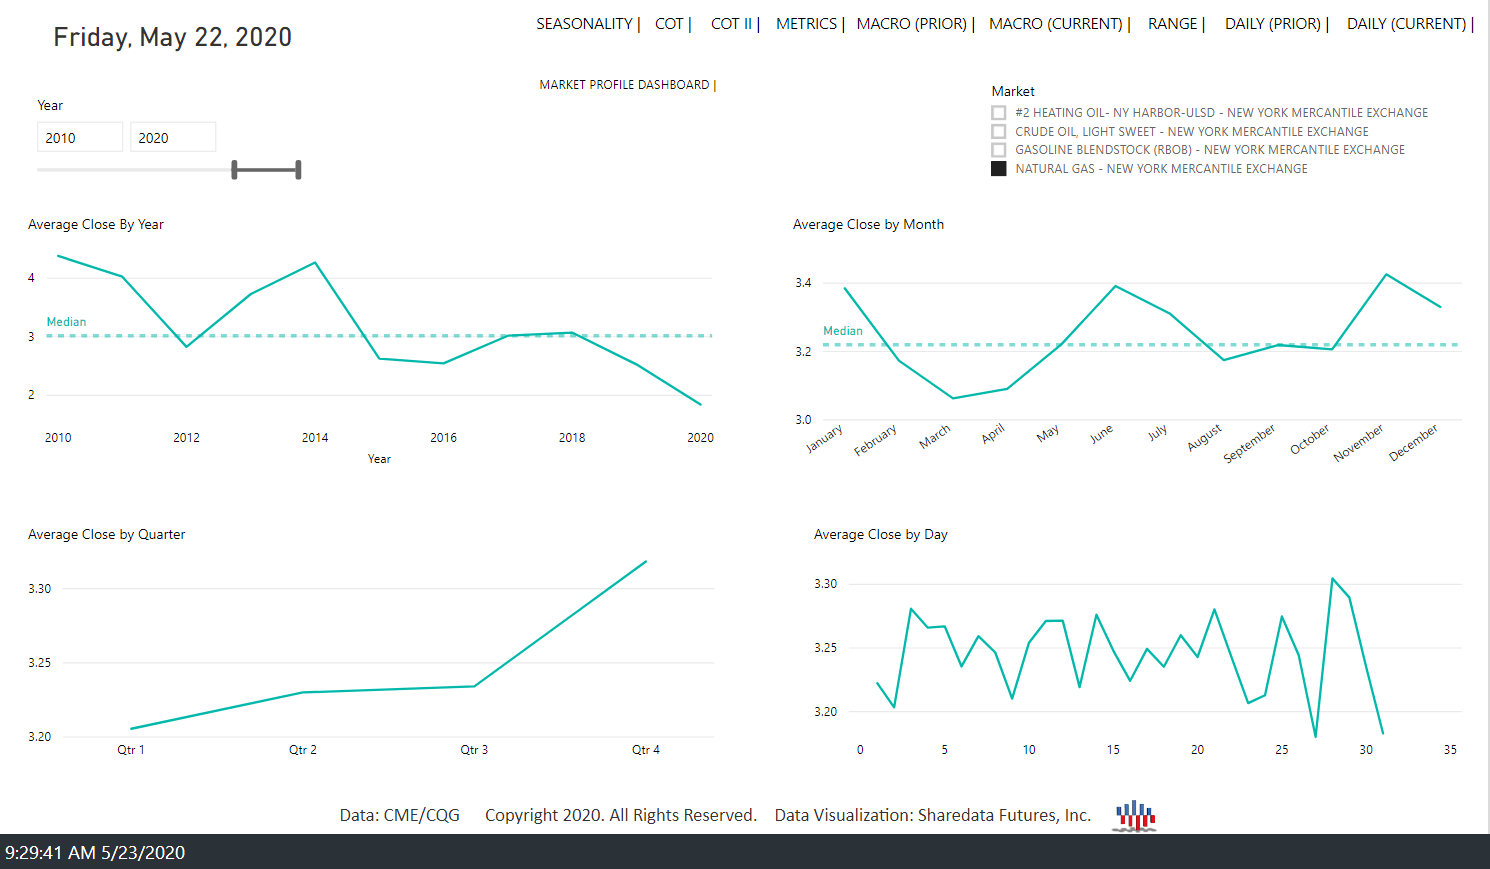
This week’s primary expectation of price discovery higher developed to 1.90s as last week’s key support held early week. The breakout through the Option Wall at strike, 1.75s, early week likely saw dealer delta/gamma hedging activity increase the buying activity. The rally continued toward the Option Wall between the $1.90/1.95/2.0 strikes as an Unsecured High developed into the week’s end. Within the larger context, this week’s auction represents continued rotational trade in the multi-month consolidation area, 1.51s-2.16s, near major support. The structural low, 1.51s, and subsequent relief rally toward 2.16s have developed within the context of seasonal highs that have formed into June over the last 10 years.
Focus into next week rests upon the market response to this week’s Unsecured High, 1.90s, at prior key resistance. Unsecured highs are highs that lack single print excess (inverted hammers in candlestick parlance) which is required to halt a directional phase. Unsecured highs are either repaired via the formation of excess, or they fail resulting in further trend continuation. Sell-side failure to drive price lower from this area will target key supply clusters above, 1.93s-2.00s/2.07s-2.16s, respectively. Alternatively, buy-side failure to drive price higher from this area will target key demand clusters below, 1.73s-1.69s/1.64s-1.59s, respectively. The highest probability path, near-term, is buy-side, barring failure of 1.83s as support. The four-year demand cluster, 2.20s-1.50s, which we have noted for months and which the market revisited, remains key to the larger structural view. In the intermediate-term (3-6 month) context, conditions in the leveraged capital posture reflect signs of potential structural low formation as the market trades to this major demand area.
Source: Sharedata Futures, Inc.
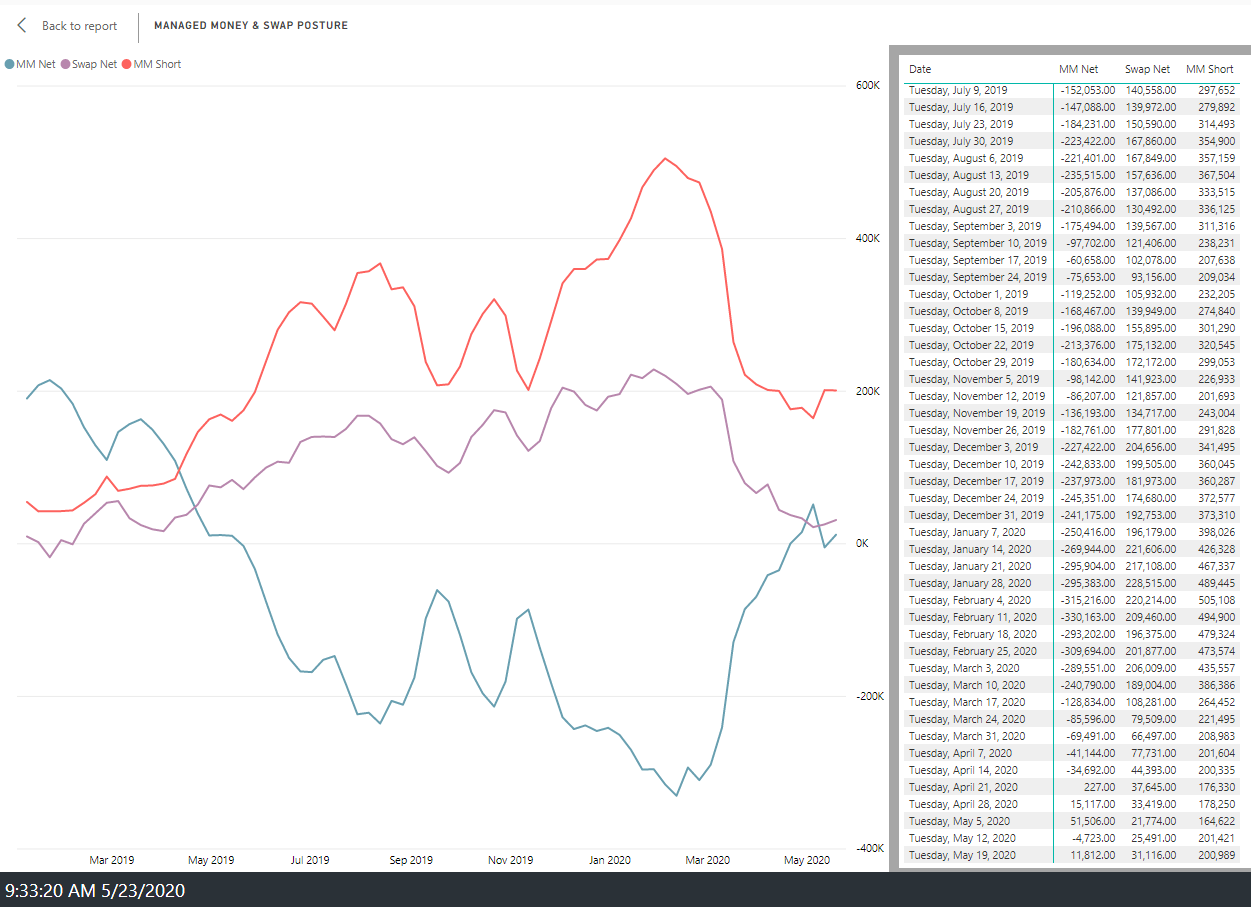
It is worth noting that despite the approximately 59% decline from the November 2018 price high to the August 2019 price low, only from June through early September 2019 had the Managed Money (MM) short posture begun to reach levels consistent with structural low formation (typically 300-350k contracts). MM short posture peaked the week of 13 August 2019 (-367k contracts) declining into mid-November 2019 (-201k contracts). This development implied that MM sentiment reached extreme bearishness as price reached lows resulting in the rally from 2.02s to 2.90s. Similarly, MM short posture peaked again the week of 04 February 2020 (-505k contracts) before declining into mid-April 2019 (-176k contracts) resulting in the rally from 1.52s to 2.16s. In the prior two historical instances of this development (March 2016 and December 2017), NG subsequently rose from 1.70s to 3.25s and 2.65s to 4.5s, respectively. This week’s data shows MM net posture went positive (11k contracts) signaling a continued stall in the MM net posture around zero.
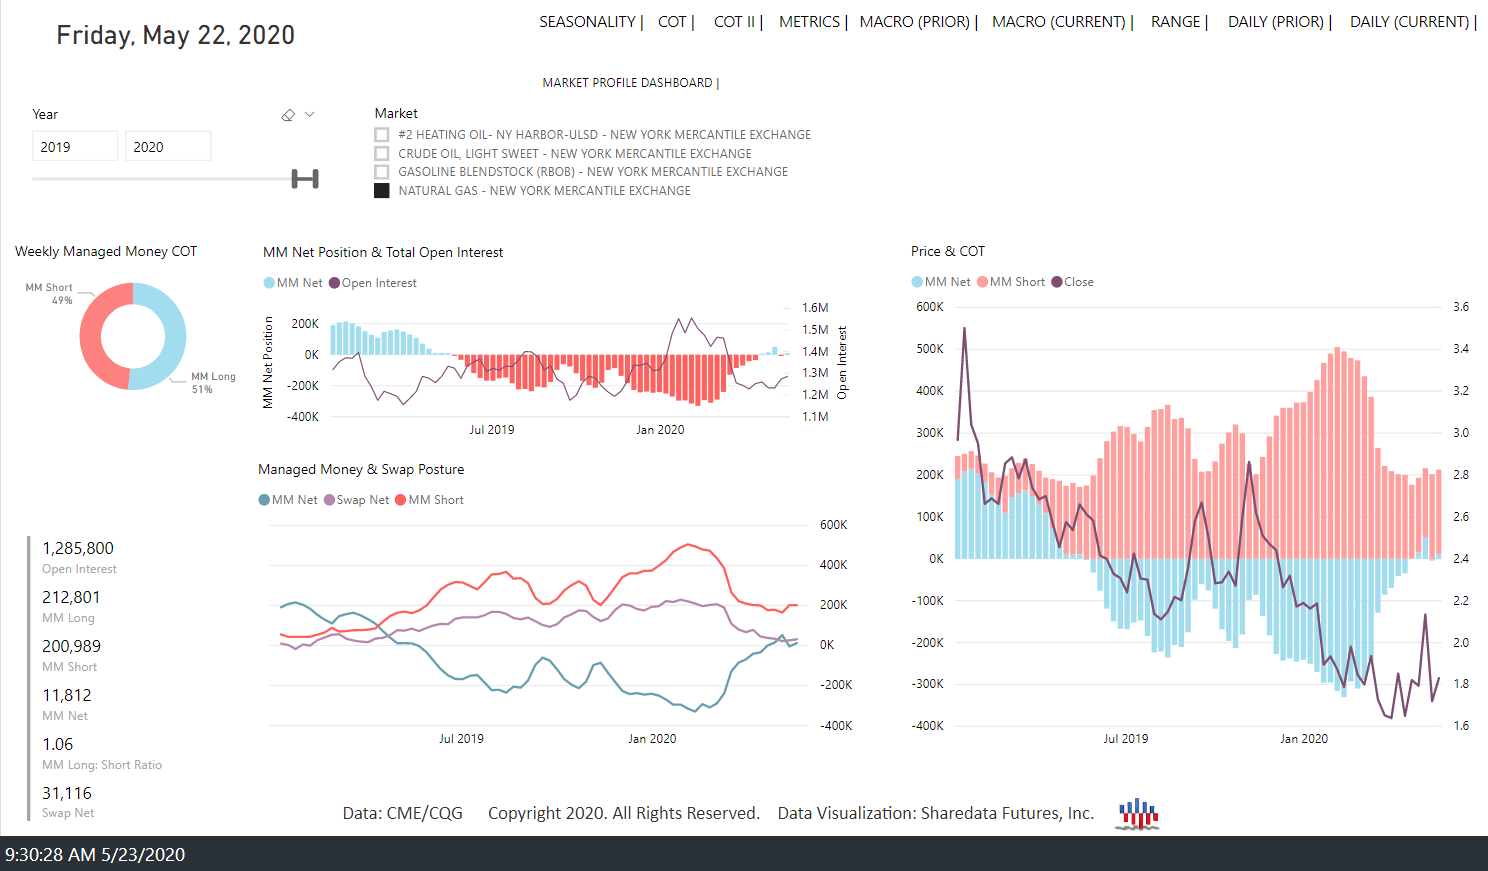
The MM short posture stands at -200k contracts as the trend lower from the 04 February high has stalled.
 Source: Sharedata Futures, Inc.
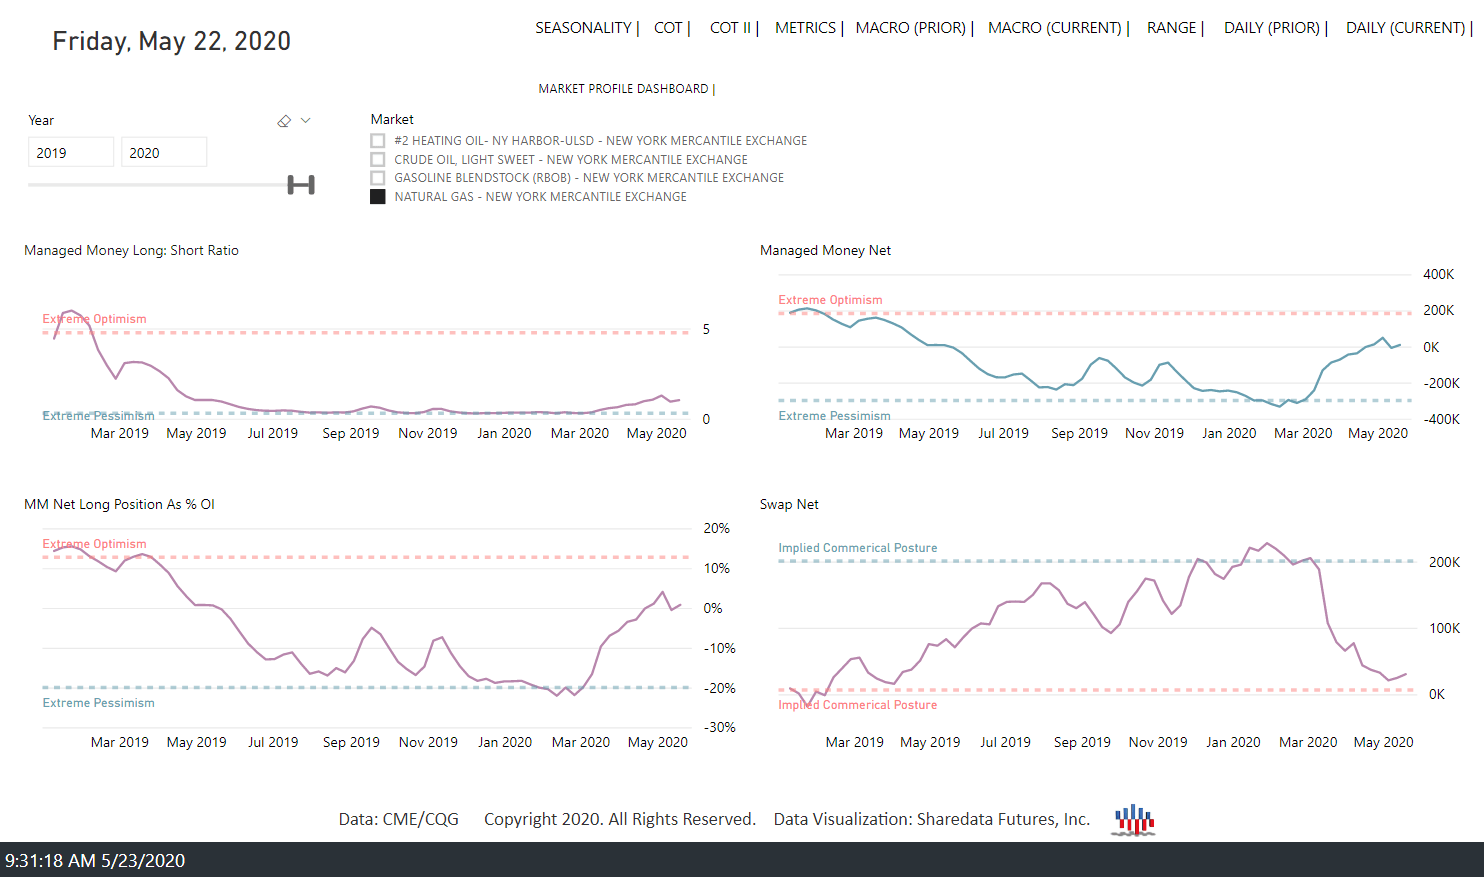
The MM Long: Short Ratio and MM Net Long Position As % Of Open Interest remain at levels typically consistent with structural low formation. MM posture reached quantity needed to develop structural lows from July-September 2019 and recent levels were more extreme. MM posture is now reflecting the material shift of net posture at/near major lows. The result was a meaningful rally from 1.52s to 2.16s. Rotation lower back toward key support has since developed. Despite this, based on the market generated data, it remains likely that a structural low has developed, but near-term price weakness may persist.
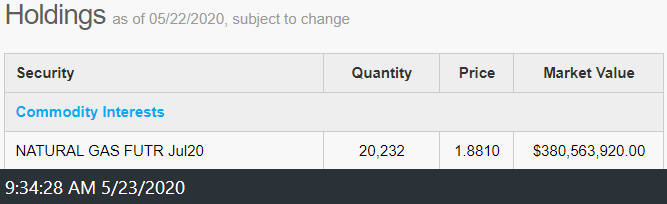
Contract roll period for the natural gas ETF, UNG, was 13th-18th May. Unlike recent activity in WTI oil derivatives, the natural gas derivatives have seen no such dislocation yet. It is worth noting, however, that unlike USO, UNG still maintains the bulk of its NG futures portfolio in the front month contract, currently the July contract (20.2k contracts). UNG holds 20k contracts concentrated in the prompt month only, representing approximately 9% of all MM long contracts. While UNG still holds a large portion of its portfolio in the front month, its aggregate position as a percentage of the market total is small, compared to the WTI-USO relationship. That said, as seen in April’s WTI contract roll, that type of concentration in the front of the curve can create problems when large enough.
Source: USCF Investments
The market structure, order flow, and leveraged capital posture provide the empirical evidence needed to observe both where asymmetric opportunity and risk reside.
Disclosure: I/we have no positions in any stocks mentioned, and no plans to initiate any positions within the next 72 hours. I wrote this article myself, and it expresses my own opinions. I am not receiving compensation for it (other than from Seeking Alpha). I have no business relationship with any company whose stock is mentioned in this article.
