
This post was originally published on this site
Early Friday futures action shows Wall Street may struggle to break a three-day losing streak. No surprise why: bond yields, which have enjoyed a tight inverse correlation to stocks of late, remain near recent highs.
At least benchmark long-term interest rates near multiyear peaks suggests the market is sanguine about the health of the U.S. economy. The dominant narrative among investors is that it has been able to absorb the Federal Reserve’s sharp hike in borrowing costs without cracking — the so-called soft landing.
However, for it to be true that the U.S. economy can avoid a contraction in coming quarters we must accept that the predictive recession message of a deeply inverted yield curve — where short-term Treasury yields are notably higher than 10-years — can now be dismissed by equity investors.
That would be a mistake, says Michael Darda, chief economist and market strategist at Roth MKM.
Darda has examined seven-decades of the yield curve and how it relates to the business cycle and equity market performance. Using the spread between 10-year
BX:TMUBMUSD10Y
and 1-year
BX:TMUBMUSD01Y
bond yields he found there have been 12 inversions since the 1950’s.

Source: Roth MKM
Importantly, during these occasions the inversion was shown to have preceded the eventual recession by a wide range of between seven to 25 months, with an average lag of 14 months.
“A look back through the financial news pages shows that soft landing stories were common and the yield curve signal was dismissed going into the 1990-1991, 2001, 2007-2009 and 2020 recessions,” he says.
“Since we are currently 13 months into inversion, it is woefully premature to presume the yield curve has given a false signal and the fabled soft landing is in the bag,” Darda adds.
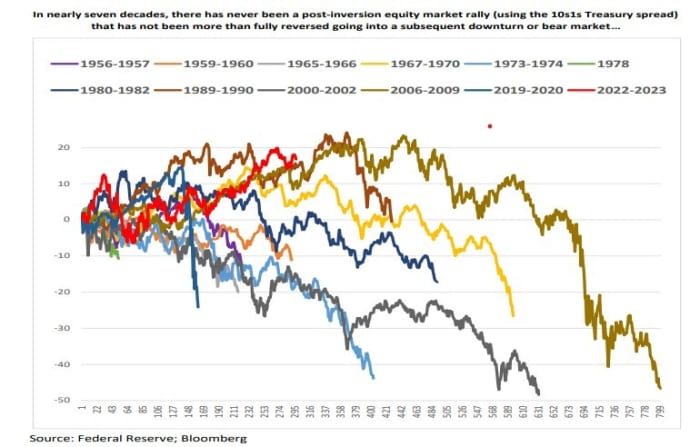
The crucial issue for equity investors is that they should be wary of the average double-digit-percentage-point stock rallies that come in the immediate aftermath of an inversion.
That’s because Darda’s research shows in nearly seven decades there has never been a post-inversion equity rally that was not completely reversed going into subsequent recessions/bear markets.
Source: Roth MKM
Not even recent action is unprecedented. U.S. stocks rallied 20% from when the yield curve inverted in July 2022 to July this year. But such bounces have happened before, in 1989-90, for a gain of 24%, and 2006-07, up 23%, and both times the post-inversion rallies were wiped out.
“On average, equity markets ‘bottomed’ about 20% below where they were when the curve first went into inversion. The range of outcomes would be consistent with the S&P 500 having more than 20% downside from the recent market highs,” Darda says.
“In short, those who are ‘doubling down’ on the soft landing/ongoing bull market call now are making a wager on an unprecedented occurrence.”
Markets
U.S. stock-index futures
ES00,
NQ00,
are mildly mixed as benchmark Treasury yields
BX:TMUBMUSD10Y
dip slightly. The dollar
DXY
is a fraction lower, while oil prices
CL.1,
rise and gold
GC00,
gains.
For more market updates plus actionable trade ideas for stocks, options and crypto, subscribe to MarketDiem by Investor’s Business Daily.
The buzz
U.S. economic data on Friday, include the July wholesale inventories report, due at 10 a.m. Eastern, the nation’s quarterly financial accounts at noon, and July consumer credit at 3 p.m..
Fed Vice Chair for Supervision Michael Barr is speaking at 9 a.m., and San Francisco Fed President Mary Daly is due to speak at 11 a.m.
The SEC is investigating Ryan Cohen’s Bed Bath & Beyond trades, says the WSJ.
DocuSign Inc. shares
DOCU,
are up nearly 2% in premarket trading after the e-signature company topped earnings expectations and hiked its guidance.
Shares of RH
RH,
the furniture retailer formerly known as Restoration Hardware, are down nearly 8% after the company warned that the higher-end housing market that the company depends on would likely remain rocky.
Trading in Hong Kong was shut after the region suffered the heaviest rainfall in 140 years.
Best of the web
South Korean film industry rocked by box office fraud allegations.
The $100 billion luxury complex that’s sitting empty and unfinished.
Elon Musk ordered Starlink to be turned off during Ukraine offensive, book says.
The chart
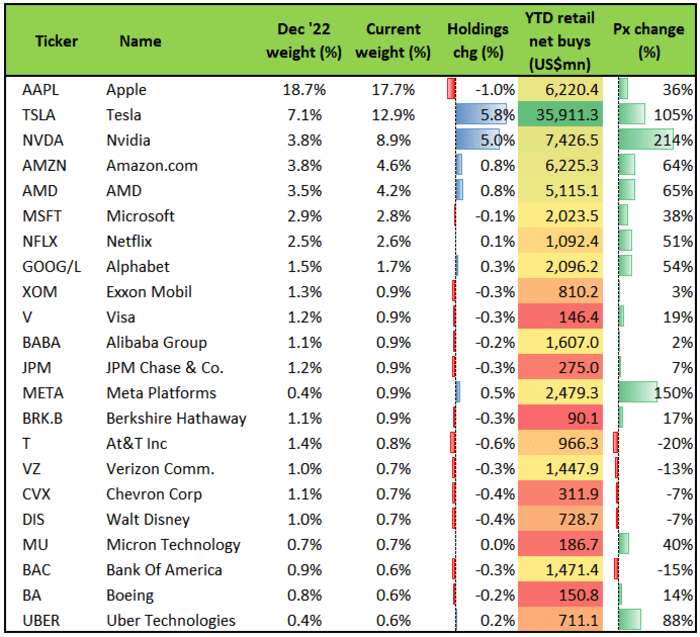
It’s well known that when Apple shares fall, their roughly 7% weighting in the S&P 500 means the market in aggregate tends to suffer. But as the table from Vanda Research shows, it’s notably worse for the portfolio’s of retail investors. They’ll be really hoping nothing bad happens to Tesla
TSLA,
too.
Vanda Research
“Tesla continues to draw the most inflows, with
NVDA,
AAPL,
and
AMD,
trailing from a distance. Importantly, given Apple’s popularity among individual traders, as the stock goes, generally so does the S&P and, with that, so can retail investors’ wealth effects,” says Vanda.
Top tickers
Here were the most active stock-market tickers on MarketWatch as of 6 a.m. Eastern.
| Ticker | Security name |
|
TSLA, |
Tesla |
|
AMC, |
AMC Entertainment |
|
AAPL, |
Apple |
|
NVDA, |
Nvidia |
|
GME, |
GameStop |
|
NIO, |
NIO |
|
TTOO, |
T2 Biosystems |
|
AMZN, |
Amazon.com |
|
VFS, |
VinFast Auto |
|
MULN, |
Mullen Automotive |
Random reads
This man tried to cross the Atlantic in a hamster wheel.
Mysterious ‘golden orb’ at bottom of ocean baffles scientists.
And speaking of gold, Norwegian amateur’s ‘find of the century.’
Need to Know starts early and is updated until the opening bell, but sign up here to get it delivered once to your email box. The emailed version will be sent out at about 7:30 a.m. Eastern.
Listen to the Best New Ideas in Money podcast with MarketWatch financial columnist James Rogers and economist Stephanie Kelton

