
This post was originally published on this site
After back-to-back-to-back record closes for the Dow
DJIA,
and S&P 500
SPX,
investors might be asking what’s next?
Anyone suffering from triskaidekaphobia — the fear of the number 13 — or friggatriskaidekaphobia, fear of actual Friday 13th, might want to start their weekends early as we’re cruising through the first one since November 2020.
But in fact, the last two such Fridays — in March and November 2020 — produced 9.3% and 1.4% respective gains for the S&P 500, notes LPL Financial’s chief market strategist Ryan Detrick in a blog post. “Black cats and broken mirrors might be scary on this day, but stocks shouldn’t be,” he said.
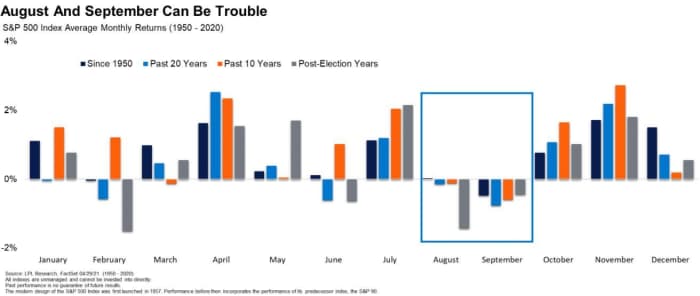
That said, August and September are historically dicey months for investors, Detrick adds.
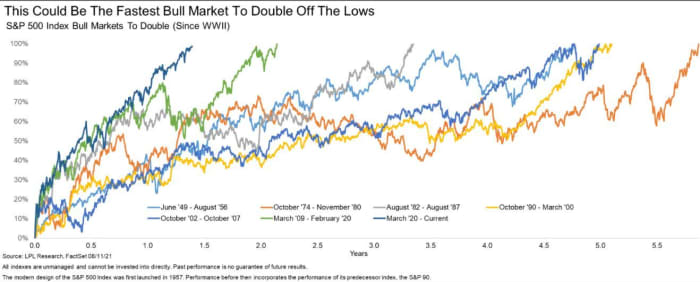
It’s also shaping up to be a bull market for the ages, possibly the fastest to double off the lows since the 1940s, Detrick said. As of Thursday’s close, the S&P 500 was 98.79% above its 2020 bear market low of 2,237.40 hit Monday, March 23, 2020, according to Dow Jones Market Data.
All that bullishness does worry some. That brings us to our call of the day from John Kosar, chief market strategist at Asbury Research, who said whether or not the S&P 500 gets an “overdue correction” depends on large tech.
“The traditional market leaders during a normal, healthy bull market — semiconductors, technology and small cap — have for the most part been inconsistent leaders in 2021. And the only two that have actually led at times — semis and tech — have been passing that mantel back and forth like they don’t want it,” Kosar told clients in a post.
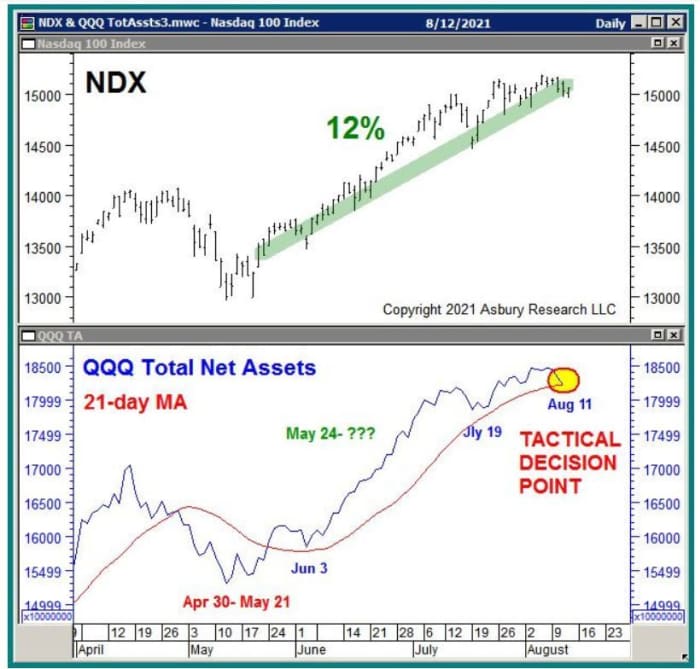
He lays things out in a series of charts looking at the performance of the Nasdaq-100
NDX,
The first shows how the index has been tested — and thus far rebounding — from its 21-day moving average (DMA), for the fourth time since rising above it on May 24.
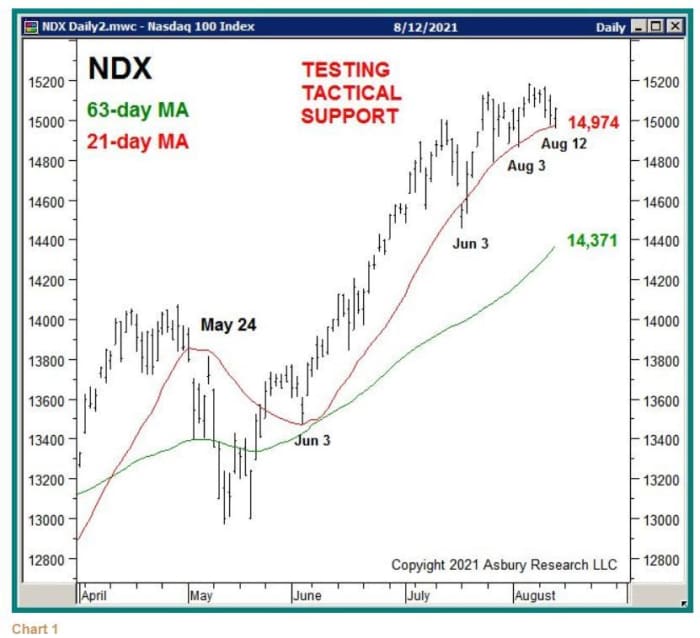
Asbury Research
His next chart (lower panel) shows daily total net assests invested in the Invesco QQQ exchange traded fund
QQQ,
which tracks the Nasdaq-100, testing their 21-DMA from above. As the chart shows, those assets have been above that DMA since May 24, which points to monthly expansion, a trend that has driven a 12% rise in techs.
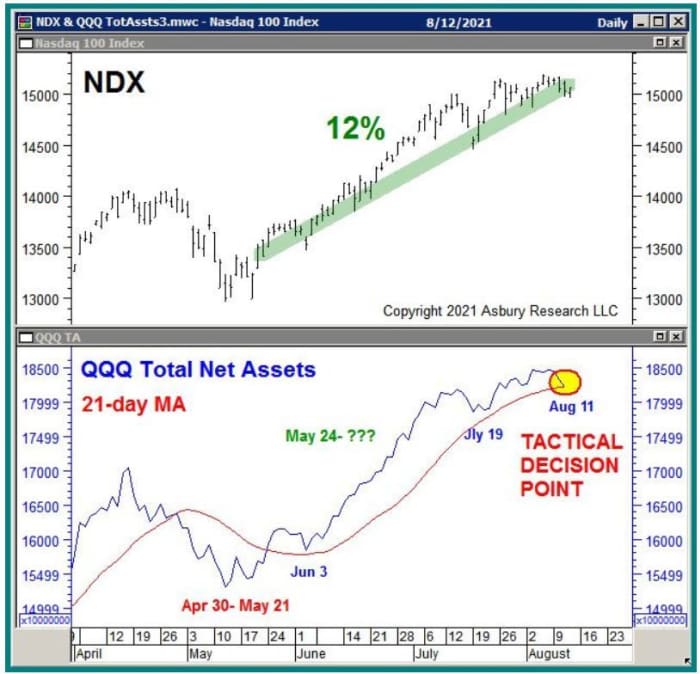
Asbury Research
In his last chart, the strategist shows that since Aug. 10, the QQQ has moved to a trend of monthly relative underperformance versus the SPDR S&P 500 Trust ETF
SPY,
The red highlights on the left point to a similar trend for QQQ versus the S&P 500 ETF between April 26 and May 24, which coincided with an 8% fall in QQQ and 8% decline in the Nasdaq-100.
Asbury Research
In summary, his first two charts are bullish, showing an advance for big tech is intact, but Chart 3 warns of downside to come.
“A decline below NDX 14,974, and/or a new trend of monthly contraction in the total net assets invested in QQQ, would confirm this and suggest that a Tactical correction has begun in this market-leading index,” said Kosar.
Opinion: The ultimate bull case for the stock market: It keeps making new highs
China shuts a vital port and Disney’s earnings blowout
Data for Friday includes import prices for July and the University of Michigan’s preliminary consumer sentiment index for August.
The U.S. Food and Drug Administration late Thursday authorized an extra COVID-19 shot for those with compromised immune systems, adding to the emergency-use authorizations for the Pfizer
PFE,
and Moderna
MRNA,
COVID-19 vaccines.
Asia stocks came under pressure Friday, with some fingers pointing at a potential blow to supply chains after China shut down the Meishan Terminal of the Ningbo-Zhoushan Port over a COVID-19 case. It’s the world’s biggest by tonnage shipped. Import prices also surged in South Korea.
Disney
DIS,
reported its strongest sales and profit since before the pandemic late Thursday, as theme park business boomed and 116 million new subscribers were added to its streaming service. Shares are up.
ContextLogic WISH shares are slumping after the parent of e-commerce site Wish reported slowing demand for products and less activity on its platforms. Airbnb shares ABNB are down after the lodging-booking company reported blowout earnings, but didn’t give specific guidance. DoorDash
DASH,
is taking a hit after record orders and order volume from the online food-ordering group, but a weak forward outlook.
Tesla´s
TSLA,
chief executive officer Elon Musk will on Friday host a leading candidate to replace German Chancellor Angela Merkel at the electric car maker’s work-in-progress car and battery factory.
Amazon Studios
AMZN,
will move filming of its “Lord of the Rings” TV series to the U.K., despite New Zealand offering up extra subsidies.
The markets
U.S. stock futures
ES00,
NQ00,
are mostly higher, potentially pointing to more records ahead, and Europe
SXXP,
is looking at its 10th straight win. But oil
CL00,
BRN00,
is slipping after COVID-19-related demand warnings from the International Energy Agency and the Organization of the Petroleum Exporting Countries.
Random reads
Return to old-fashioned farming proves a runaway success for vinyards and olive groves in Spain’s Andalusia region.
The White Sox outslugged the Yankees in Iowa’s “Field of Dreams” baseball game that seemed cheesy at times, but maybe what we didn’t even know we needed.
What happens when a woman mourning her mother’s death reaches out on Twitter:
Need to Know starts early and is updated until the opening bell, but sign up here to get it delivered once to your email box. The emailed version will be sent out at about 7:30 a.m. Eastern.
Want more for the day ahead? Sign up for The Barron’s Daily, a morning briefing for investors, including exclusive commentary from Barron’s and MarketWatch writers.


