
This post was originally published on this site
The broader stock market, as measured by the S&P 500 Index, continues to plow ahead, making a series of all-time intraday and closing highs.
This comes despite a nagging negative divergence with some of the market internals. But since “price is king,” one must respect the strong positive action of the S&P 500
SPX,
The Index has support at 4370 points, which has been doubly tested, and as long as that is in place, negative divergences make little difference; it is necessary to be long in line with the positive trend of the chart.
Below 4370, there are other support levels, too: 4233, 4165 and 4060 (the latter two of which have been doubly tested as well). However, 4370 is the “key” support level now, and if it were broken, that would call for a more bearish outlook.
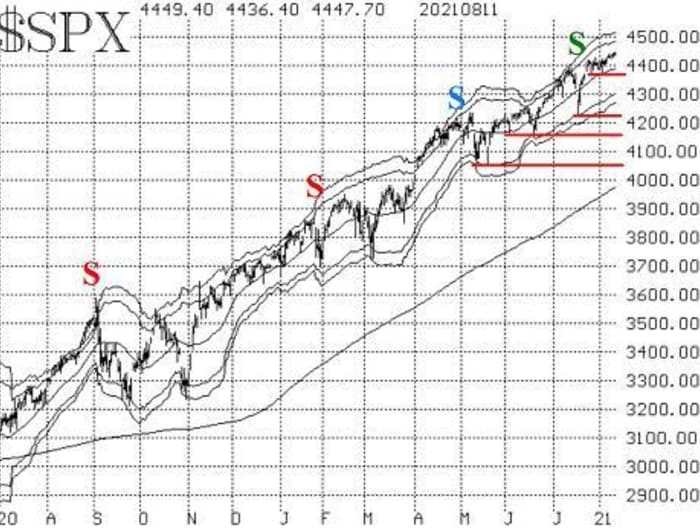
The McMillan Volatility Band (MVB) sell signal (marked in green on the accompanying chart) remains in place. The realized volatility of the S&P 500 has begun to decline, which will pull the bands toward the center, making a resolution of this signal more likely. The signal would be stopped out by a close above the +4σ Band and would fulfill its target by hitting the -4σ Band — neither of which is imminent at this time.
Speaking of realized volatility, the recent daily ranges of SPX have begun to shrink (even though the index is advancing). That has caused the realized volatility (20-day historical volatility, or HV20) of SPX to fall back to 11%. There is still a realized volatility sell signal in place, but it would be stopped out if HV20 fell to 9%.
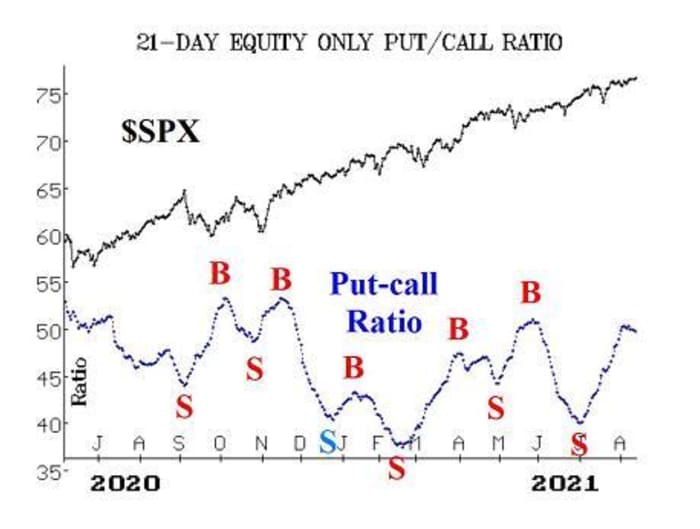
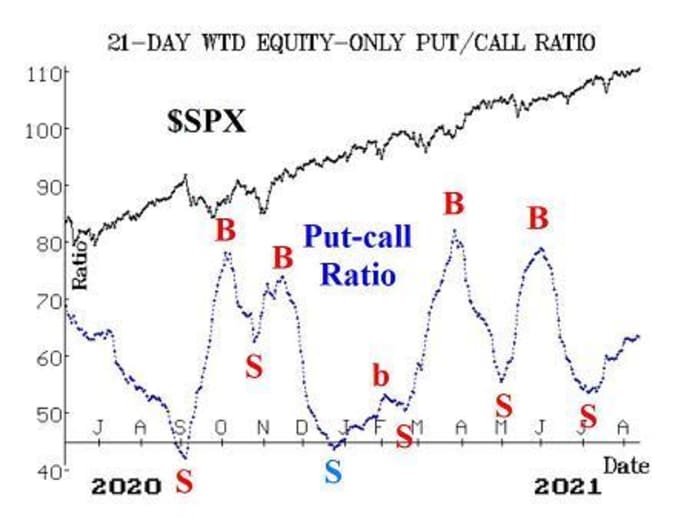
Equity-only put-call ratios remain on sell signals as well. Even though there is a slight “wiggle” on the standard chart, our computer analysis programs continue to predict that these ratios will continue to rise. A rising equity-only put-call ratio is bearish for stocks. These ratios have been on sell signals since early July, but SPX has certainly not responded to them over that period. Rather, the “average” stock has struggled since then. That’s one part of market internals that’s not so great. Traders have been buying puts on those struggling stocks, sending these equity-only put-call ratios higher.
Market breadth continues to be another problem for the market. The breadth oscillators have managed to stay on buy signals, so that is encouraging. However, they are much weaker than they “should” be. Normally, with SPX making a series of new all-time highs, breadth would be very accommodating, and these breadth oscillators would be deeply overbought. That is not the case now. In fact, they are not overbought at all — not even by a small amount.
Perhaps the greatest area of negative divergence, and the one most easily measured, is with the cumulative breadth indicators. They have not made new all-time highs since June 11, but SPX has made a new all-time high on 23 trading days since then. That is a major divergence that has now lasted 42 trading days (since June 11).
A recent study showed that these lengthy negative divergences often lead to bear markets, but that the average length of time of the divergence before the bear market started was six months! So, a negative divergence is certainly not a market-timing tool, but it is a valid warning sign that one should not be complacent when such a divergence is in place: monitor and heed your stops, and do not ignore confirmed sell signals from your indicators.
On the NYSE, new 52-week highs continue to outnumber new 52-week Lows. That keeps this indicator on a bullish status. The differential has shrunk from where it was a couple of months ago, but it remains bullish.
Implied volatility measures — those having to do with VIX
VIX,
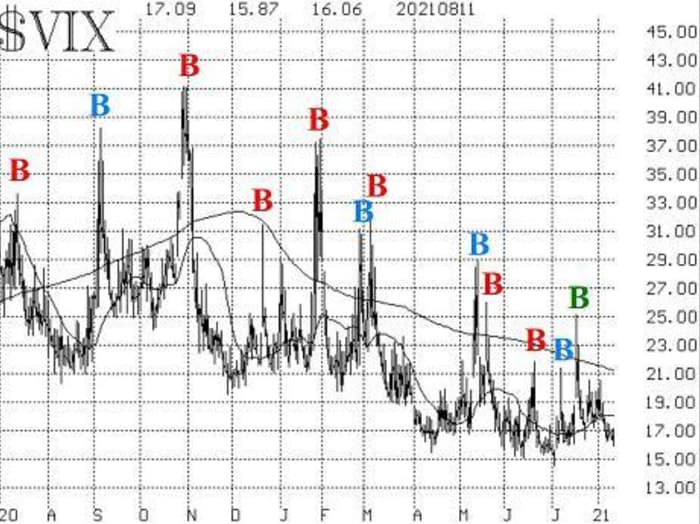
and its tradeable products — continue to be bullish indicators for stocks. The VIX “spike peak” buy signal of July 20 remains in place. That will remain true as long as it is not stopped by VIX returning to “spiking” mode. The signal lasts for 22 trading days if not stopped out, and that would take it out into next week.
Furthermore, the trend of VIX is downward: VIX is below its 20-day moving average (MA), which is below the 200-day MA, and that is bullish for stocks. Finally, the construct of volatility derivatives is bullish for stocks, too: The VIX futures are trading at premiums to VIX, and their term structure slopes upward (as does that of the CBOE Volatility Indices).
In summary, the SPX chart is bullish, and that means you should have a “core” bullish position in place.
New recommendation: Conditional S&P 500 sell signal
Based on the context above, we are going to lay out some parameters regarding taking a bearish position should SPX support be broken:
IF $SPX trades below 4370 and stays there for an hour,
THEN Buy 1 SPY Aug (27th) at-the-money put
And Sell 1 SPY Aug (27th) put with a striking price 25 points lower.
In addition,
IF $SPX closes below 4370,
THEN Buy another bear spread:
Buy 1 (more) SPY Aug (27th) at-the-money put
And Sell 1 (more) SPY Aug (27th) put with a striking price 25 points lower.
Note that it is possible that the second condition (close below 4370) could occur without the first condition being satisfied (if $SPX breaks below 4370 late in a trading day). If that is the case, then buy two of these spreads on the close.
Finally, if these spreads are established, stop yourself out of all of these bear spreads on an SPX close above 4430.
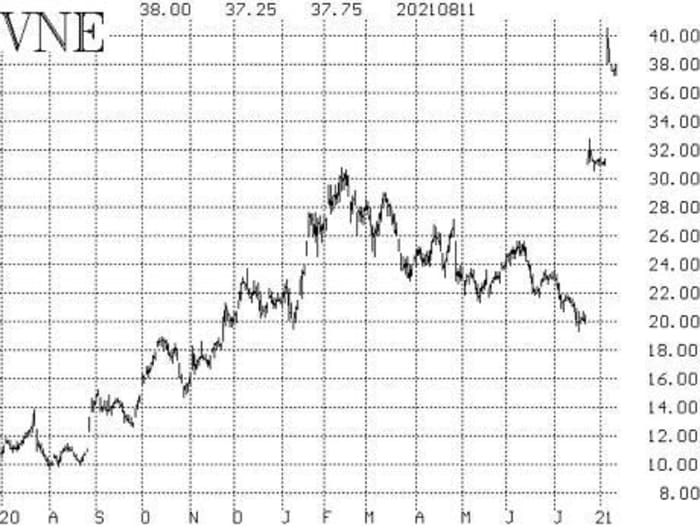
New recommendation: Veoneer
Veoneer
VNE,
is in a bidding war. The company had previously agreed to be acquired by Magna International
MGA,
for $31.25 per share. The stock traded slightly above that price, though, as some traders expected an improved bid. Now Qualcomm
QCOM,
has bid $37. The stock is trading higher than $37 in anticipation of a bidding war. Stock volume patterns are very strong and improving. The option markets are wide and illiquid, but we want to put in a bid:
Buy 5 VNE Sept (17th) 38 calls at a price of 1.20 or less.
Follow-up action
Long 3 DUK Aug (20th) 100 calls: raise the trailing stop to 103.80.
Long 4 expiring DBX Aug (13th) 30.5 calls: roll to the Sept (3rd) 32 calls. Raise the trailing stop to 31.20.
Long 1 RAPT Aug (20th) 30 call. The stop yourself remains at 26.
Long 1 SPY Aug (20th) 431 call: this positionwas bought in line with the VIX “spike peak” buy signal of July 20th. Continue to hold for 22 days from that date (this signal will “expire” next week). So, roll up to the Sept (3rd) 443 calls. The position would be stopped out if $VIX were to rise 3.00 points or more within any 3-day period, using closing prices. If it is stopped out, then re-enter with an at-the-money call on the ensuing buy signal.
Long 2 HOLX Sept (17th) 75 calls: these calls were rolled up previously. Raise the trailing stop to 73.
Long 1 SPY Aug (20th) 433 put and Short 1 SPY Aug (20th) 408 put: this spread was bought in line with the equity-only put-call ratio sell signals. Those sell signals are still in place, so continue to hold this spread. We will update the situation weekly.
Long 5 STAR Aug (20th) 22.5 calls: raise the stop to 24.60.
Long 5 MGI Aug (20th) 10 calls: hold this position without a stop initially, to see if a takeover bid can materialize.
Long 2 DHI Sept (17th) 92.5 calls: these calls were bought on July 29th, when DHI closed above 93. Since this recommendation was based on a put-call ratio buy signal for DHI, we will hold the position as long as that buy signal is still in effect, which it is.
Long 2 AFRM Sept (17th) 65 calls and Short 2 AFRM Sept (17th) 80 calls: hold without a stop while the takeover rumors play out.
Send questions to: lmcmillan@optionstrategist.com.
Lawrence G. McMillan is president of McMillan Analysis, a registered investment and commodity trading advisor. McMillan may hold positions in securities recommended in this report, both personally and in client accounts. He is an experienced trader and money manager and is the author of the best-selling book, “Options as a Strategic Investment.”
