
This post was originally published on this site
The stock market, as measured by the S&P 500 Index
SPX,
got off to a rocky start this week. But that produced enough of an oversold condition that buyers stepped in and have taken the benchmark index all the way back to the top of its trading range, at 4700 points.
The lower end of the trading range is 4500 (see the accompanying chart, below), although there is also support at this week’s lows, 4530. SPX has tried many times to break out over 4705 and hold those gains but has been unable to do so. But market internals have improved somewhat, so maybe this time it will do so.
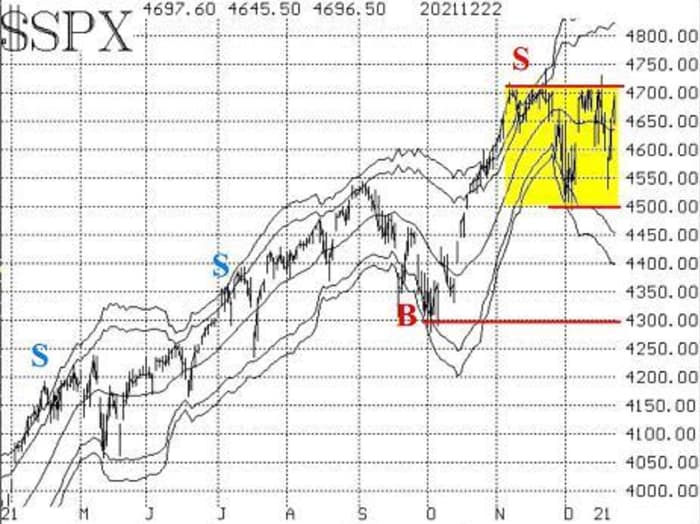
The extreme volatility that has been on display within the trading range has pushed the 20-day historical volatility (HV20) of SPX up to a historically large 21%. That is a sell signal in itself. Only if that volatility begins to retreat (falls below 15%, say), will this sell signal be terminated.
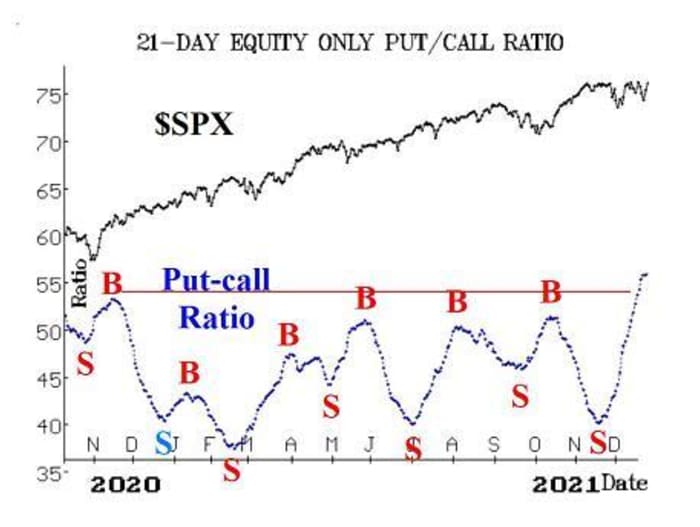
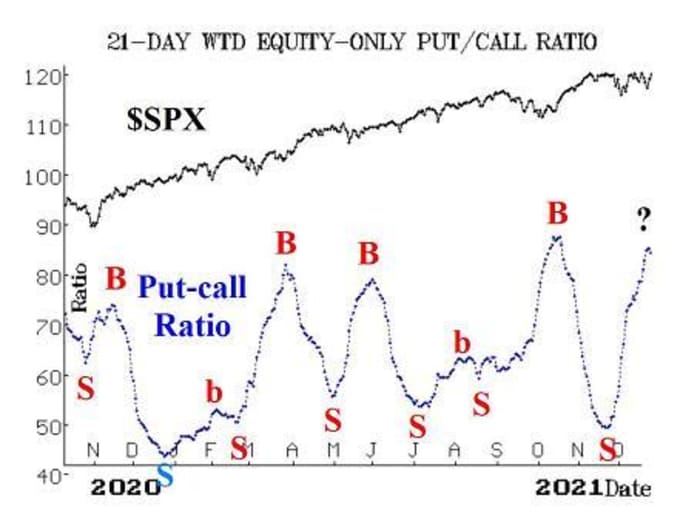
Equity-only put-call ratios have continued to rise — until yesterday (December 22nd), when they plateaued a bit. However, our computer analysis programs are still “saying” that these ratios are on a sell signal. Obviously, they are quite high on their charts, meaning they are oversold.
So a potential buy signal exists, but we need to see them begin to trend lower (and for the computer analysis programs to agree) before we can say that they are on buy signals.
Market breadth was abysmal when the market was going down. But it has recovered strongly with the rally since Monday, and now both breadth oscillators are on buy signals. We had a contingent bull spread recommendation in place and those contingencies have been fulfilled.
These oscillators had reached extreme oversold conditions in late November and early December — extremes not seen since the pandemic selling of March 2020. That sets the stage for a strong buy signal, and it is usually the second such one that is the “true” buy signal. This current signal is that second one, so this is promising for the bulls. For the record, the cumulative breadth indicators are nowhere near their old highs.
New 52-week lows have continued to outnumber new 52-week highs, even with the market rallying back this week. This situation could reverse in the coming week, but so far it has not. That means this indicator is still clinging to a sell signal. In a broad sense, it is not a constructive thing for SPX to be right at its highs, yet there are more stocks making new 52-week lows than making new 52-week highs.
The implied volatility indicators are mostly bullish, but not totally. First, the VIX “spike peak” buy signal remains in effect. Action was wild in VIX, though, as it exploded to above 27, then closed below 23 on one day (Monday, December 20th).
It is the trend of VIX that represents something of a problem. That is, VIX has continued to close above its 200-day moving average, which is just below 19 and going sideways. VIX has nearly fallen to that level for the first time in a month (note the box on the accompanying VIX chart). A clear close below that 200-day MA will be another bullish sign for stocks.
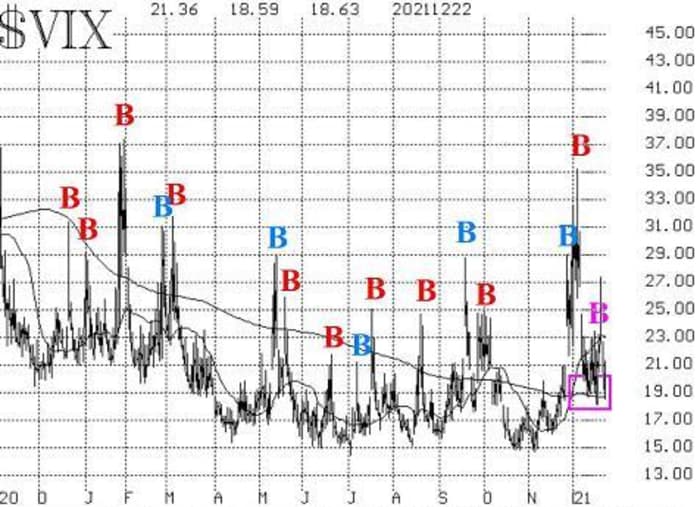
The construct of volatility derivatives has remained the most bullish indicator of all that we follow. To wit, the front-month VIX futures have continued to close at a lower price than the second-month VIX futures, and the term structures of both the VIX futures and of the CBOE Volatility Indices have continued to slope upwards. The December VIX futures have expired, so Jan is now the front month. Hence, we will be monitoring the comparison in price between Jan (front month) and Feb (second month). At this time, Fed is trading 1.70 above Jan — a bullish distance, to be sure.
Once last point: Seasonality is in favor of the bulls. Yes, supposedly that was to be true from Thanksgiving until now, but it wasn’t.
So perhaps one might take the upcoming Santa Claus rally period with a grain of salt, but it is normally positive for stocks. As identified by the late Yale Hirsch, the Santa Claus rally period extends over the last five trading days of one year, and the first two of the next. Hence, that period begins with tonight’s close (Thursday, December 23rd). If that seven-day period does not produce a positive move in SPX, then trouble often lies ahead. Or, as Yale put it: “If Santa Claus should fail to call, bears may come to Broad and Wall.”
In summary, with SPX still in this trading range, we are not carrying a “core” position. A clear breakout to new closing and intraday highs would prompt a “core” long position, however, and it is probably closer to happening now than at any time in last month.
I say that because of the improvement in market internals: Equity-only put-call ratios, breadth oscillators, and new highs vs. new lows are on or nearing buy signals. But, still, SPX has to prove it. In any case, we will be trading confirmed signals in either direction, as they occur.
New recommendation: Santa Claus rally
Even though we have a seasonal trade in place, we are going to take a bullish position for the potential Santa Claus rally:
Near the close of trading today, December 23rd,
Buy 2 SPY Jan (7th) 469 calls in line with the market.
Sell half of this position if SPY trades at 474 at any time. We will sell all remaining calls at the close of trading on the second trading day of the new year – Tuesday, January 4th.
New recommendation: Potential upside breakout
We have a “top of the trading range” position in place, and part of its follow-up action is to stop and reverse to a long call bull spread if SPX closes above 4712. If you don’t have that position in place, then you could still establish it now, since SPX is at the top of the trading range for the nth time. In any case,
IF SPX closes above 4712 on any day,
THEN Buy 2 SPY Jan (21st) at the money calls
And Sell 2 SPY Jan (21st) calls with a striking price 10 points higher.
New recommendation: Arena Pharmaceuticals
Pfizer
PFE,
and Arena
ARNA,
have agreed to the purchase of ARNA at $100 cash. The deal is expected to settle in the first half of 2022, and PFE is financing the deal with its own cash. Yet there is a wide spread here of nearly 10 points (ARNA closed at 90.73 yesterday).
Buy 2 ARNA Feb (18th) 90 calls
At a price of 3.00 or less.
ARNAL 90.73 Feb (18th) 90 calls: 2.20 bid, 3.20 offered
Follow-up action:
All stops are mental closing stops unless otherwise noted.
Long 1 SPY Dec (31st) 469 put and Short 1 SPY Dec (31st) 449 put: this spread was bought in line with the equity-only put-call ratio sell signals. This trade will be stopped out if the ratios begin to fall again. The ratios have paused (see commentary above), but have not yet rolled over to sell signals. We will monitor the situation and report it weekly.
Long 2 expiring CMS Jan (21st) 65 calls: this purchase is based on the weighted put-call ratio buy signal in CMS, and that buy signal remains in effect.
Long 3 IWM Jan (21st) 232 calls: this is the year-end seasonal bullish trade, which is off to a poor start. For now, continue to hold without a stop.
Long 2 EXC Jan (21st) 55 puts: hold as long as the weighted put-call ratio is on a sell signal.
Long 1 SPY Dec (31st) 468 puts and Short 1 SPY Dec (31st) 448 puts: this is our “trading range” spread. We took profits on half of this trade when SPX traded below 4600 on the opening on December 20th.
Meanwhile, use the following as a “stop and reverse” if SPX breaks out to the upside:
IF SPX closes above 4712 on any day,
THEN Sell the above spread and instead
Buy 2 SPY Jan (21st) at the money calls
And Sell 2 SPY Jan (21st) calls with a striking price 10 points higher.
Long 1 IWM Jan (7th) at-the-money call: this was bought in line with several buy signals that were in effect and are once again: (VIX “spike peak,” “oscillator differential,” and breadth oscillators). Continue to hold without a stop.
Long 2 EMN Jan (21st) 120: hold without a stop while these takeover rumors play out.
Long 1 SPY Jan (7th) 467 call and Short 1 SPY Jan (7th) 477 call: this was bought in line with the breadth oscillator buy signal, on December 22nd. The criteria that we specified in last week’s report for a buy signal was satisfied on that date. We will hold as long as this buy signal is in effect. We will update the situation weekly.
Send questions to: lmcmillan@optionstrategist.com.
Lawrence G. McMillan is president of McMillan Analysis, a registered investment and commodity trading advisor. McMillan may hold positions in securities recommended in this report, both personally and in client accounts. He is an experienced trader and money manager and is the author of the best-selling book, Options as a Strategic Investment.
©McMillan Analysis Corporation is registered with the SEC as an investment advisor and with the CFTC as a commodity trading advisor. The information in this newsletter has been carefully compiled from sources believed to be reliable, but accuracy and completeness are not guaranteed. The officers or directors of McMillan Analysis Corporation, or accounts managed by such persons may have positions in the securities recommended in the advisory.
