
This post was originally published on this site
The S&P 500 Index has been making all-time highs nearly every day — 13 of the past 14 trading days, to be exact.
The Nasdaq indexes have done nearly as well. Even the Dow Jones Industrial Average
DJIA,
which was lagging behind, has now joined the party. However, the broader market — including many small-caps, as measured by the Russell 2000 Index
RUT,
and the iShares Russell 2000 ETF
IWM,
— is trailing by a wide margin. This lag in the small-caps is reflected in some of our other indicators, particularly breadth and put-call ratios.
Since the S&P 500
SPX,
is strong, one must remain bullish on the market for now. There is support for SPX at 4290 (last week’s low), 4165 (the June lows) and 4060 (the May lows). As long as SPX remains above support, its chart will remain bullish.
There really isn’t any resistance, since new intraday highs are being made every day. We sometimes look at the location of the +4σ “modified Bollinger Band” (mBB) as possible resistance in that case. It currently is at 4406 and rising.
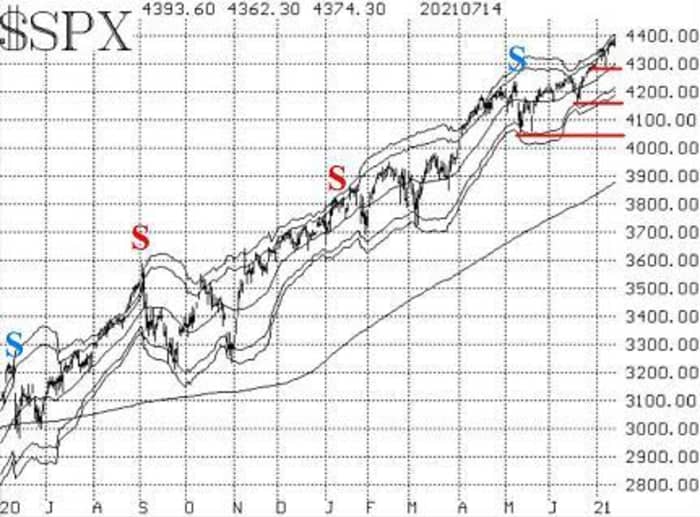
A McMillan Volatility Band (MVB) sell signal has not set up, because SPX remains below the +4σ Band currently, and because on the previous occasion that it did give a “classic” mBB sell signal, there was no follow-through.
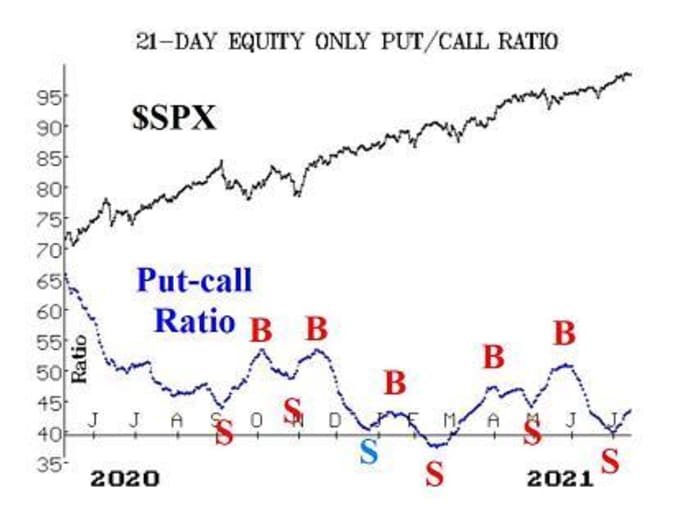
Equity-only put-call ratios are one of the internals that is bearish. There has been a substantial amount of put buying over the past couple of weeks, and the ratios turned up and have been advancing. As long as these ratios are rising, that is a sell signal for stocks. The standard ratio has been rising more sharply than the weighted, but both are rising.
Another factor that is bearish is breadth. There was one very strong, positive day of breadth on July 9, but otherwise breadth has been abysmal. Both breadth oscillators are on sell signals, and the “stocks only” breadth oscillator has been so bad that it is already in oversold territory. That is a precursor to a buy signal, but breadth is going to have to improve greatly from these levels in order for that buy signal to confirm.
Even the nearly-always-bullish comparison of new 52-week highs vs. new 52-week lows is beginning to slip. It has gone negative on Nasdaq and is barely positive in “stocks only” terms. It is better in NYSE terms, but is still not nearly as positive as it was. For now, this indicator is clinging to “bullish” status (for stocks).
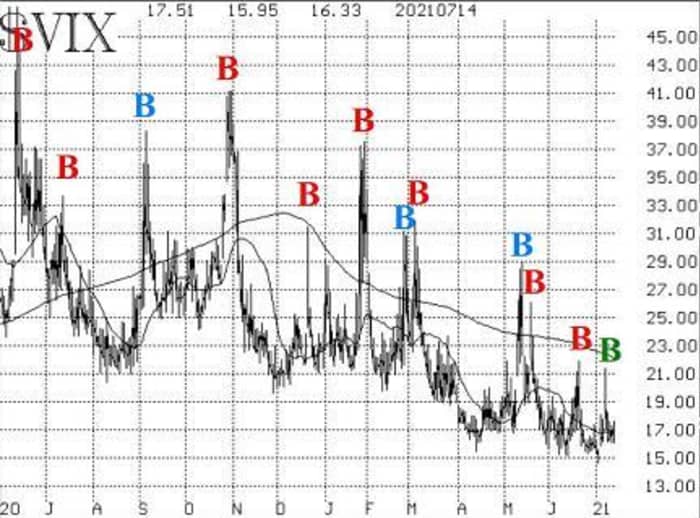
Despite the problems that the above market internals are warning us about, the volatility complex has generally remained quite positive for the stock market. The CBOE Volatility Index
VIX,
“spike peak” buy signal of July 9 remains in effect. (In fact, there has been a “spike peak” buy signal in effect since mid-May with the exception of two days where it spiked up and right back down again.)
The trend of VIX is bullish for stocks, too, in that the trend is downwards. Moreover, the construct of volatility derivatives remains positive for the stock market, since the VIX futures are trading at premiums to VIX, and the term structures continue to slope upward.
So, once again, we retain a “core” bullish opinion and position because of the strong trends present in SPX (upwards) and VIX (downwards). However, we will trade confirmed sell signals around that “core” bullish position, because the general warning sides of the market internals should not be ignored.
New recommendation: iStar
iStar Inc.
STAR,
is exploring the sale of net lease assets. The stock broke out to 13-year highs. Stock volume patterns are very strong and improving rapidly. There is support at 20-1/2 to 21.
Buy 5 STAR Aug (20th) 22.5 calls in line with the market.
Then set a closing stop at 20.50.
Follow-up action
All stops are mental closing stops unless otherwise noted.
Long 3 expiring DUK July (16th) 100 calls: roll to Aug (20th) 100 calls.
Long 1 SPY July (30th) 433 call and Long 1 expiring SPY July (16th) 420 put: this was originally a long straddle. Let the put expire worthless. Set a stop to sell the call if SPY closes below 431.
Long 4 expiring CERN July (16th) 80 calls: sell these calls and do not replace them.
Long 0 CSOD July (16th) 47.5 calls: these calls were stopped out on July 14th, when CSOD closed below 51.
Long 4 expiring DBX July (16th) 28 calls: roll to the Aug (13th) 30.5 calls. Raise the trailing, closing stop to 29.80.
Long 6 expiring CVA July (16th) 17.5 calls: CVA received a $20.25 cash takeover offer and has accepted it. Sell your calls to close the position. Do not sell them below parity.
Long 4 expiring SDC July (16th) 9 calls: the rumors have not materialized here, so let these calls expire and do not replace them.
Long 1 expiring RAPT July (16th) 30 call: I would have thought something more volatile would have emerged by now on this stock, but it has not. Roll to the Aug (20th) 30 call. The stop yourself remains at 26.
Long 2 expiring SPY July (16th) 425 calls: were bought on June 24th, when SPX broke out to new highs and closed above 4260. Roll to the SPY Aug (6th) 435 calls. Stop yourself out on a close below 431 by SPY.
Long 1 SPY July (23rd) 425 call: this positionwas originally bought in line with the VIX “spike peak” buy signal. It will remain in place for 22 days, unless VIX returns to “spiking” mode – that is, a rise of 3.00 or more points over any 3-day period, using closing prices. If VIX does return to spiking mode, then take the next “spike peak” buy signal that occurs.
Long 1 SPY July (30th) 429 put and short 1 SPY July (30th) 409 put: this spread was bought because of the breadth oscillator sell signals. During the past week, breadth took what looked like a positive turn, but then deteriorated again. So this spread is still being held. We will hold this spread as long as these breadth oscillators remain on sell signals. That status will be updated weekly.
Long 2 HOLX Sept (17th) 65 calls: stop yourself out on a close below 65.
Long 1 SPY Aug (20th) 433 put and Short 1 SPY Aug (20th) 408 put: this spread was bought in line with the equity-only put-call ratio sell signals. Those sell signals are still in place, so continue to hold this spread. We will update the situation weekly.
Long 4 AVCT Aug (20th) 5 calls: Stop yourself out on a close below 5 by AVCT.
Send questions to: lmcmillan@optionstrategist.com.
Lawrence G. McMillan is president of McMillan Analysis, a registered investment and commodity trading advisor. McMillan may hold positions in securities recommended in this report, both personally and in client accounts. He is an experienced trader and money manager and is the author of the best-selling book,
undefined
.


