
This post was originally published on this site
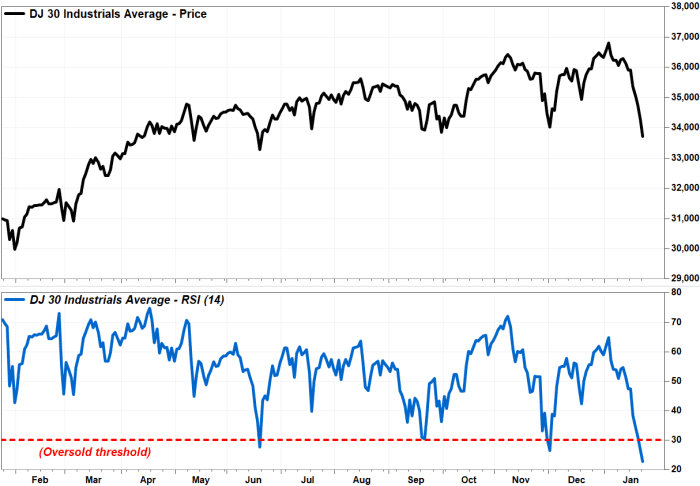
The Dow Jones Industrial Average’s seven-day plunge has produced the most oversold reading in a key technical indicator in nearly two years, but as history suggests, oversold doesn’t necessarily mean over.
The Dow
DJIA,
fell 563 points, or 1.6%, in afternoon trading Monday toward a seven-month low (it was down 1,115 points at Monday’s low), and has tumbled 2,587 points, or 7.1%, amid a seven-session losing streak. That’s the worst seven-day performance since March 2020.
The blue chip barometer’s Relative Strength Index (RSI), a momentum indicator that gauges the magnitude of recent declines against recent rallies, has fallen to 24.01, according to FactSet, while many chart watchers believe readings below 30.00 depict an oversold condition.
Keep in mind that oversold readings can last for weeks, and many technical analysts actually believe that the ability to produce an oversold reading is a sign of a downtrend’s strength.
FactSet, MarketWatch
For example, the Dow’s current RSI reading is the lowest since the RSI bottomed out on Feb. 28, 2020 at 17.43, when the Dow closed at 25,409.36.
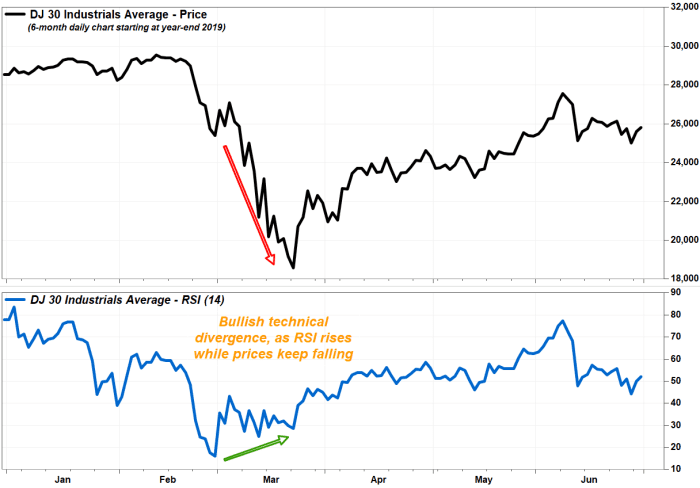
Meanwhile, the Dow didn’t bottom until it fell another 6,817 points, or 26.8%, to the March 23, 2020 close of 18,591.93, when the RSI was up to 28.84.
FactSet, MarketWatch
Basically, the key to reading the RSI is to watch for a “bullish divergence,” in which the RSI is rising while the Dow keeps falling, a pattern which suggests an oversold bounce is due. But like the last time, that divergence could last for weeks.


