
This post was originally published on this site
Major U.S. stock benchmarks have notched all-time highs this week, but other gauges of equity performance trail earlier peaks this year as some analysts have begun to worry about market breadth.
The Value Line Geometric Index
VALUG,
an equally-weighted price measure of around 1,700 stocks traded in U.S. markets, closed at a record 685 on June 8 and has been trading below its 50-day moving average for most of this month, according to FactSet data. The index closed Wednesday at almost 662, not far from but still 3% off its peak, the data show.
The Value Line index has more participation than the S&P 500
SPX,
a popular gauge of the U.S. stock market that tracks large-cap companies and has significant exposure to information technology, said Frank Cappelleri, a desk strategist at Instinet, in an interview. A rally in shares of smaller companies could help propel the Value Line index higher, said Cappelleri, adding that the rotation between cyclical and growth bets has meanwhile supported major benchmarks.
He said he’s been watching “the passing of the performance baton” closely.
“Rotation has come and saved the S&P 500 every time,” said Cappelleri. “If large-cap takes a breather, are we going to see rotation back into the previous underperforming areas?”
See: Market fragility lingers as VIX climbs even with U.S. stocks rising to peaks, BofA says
Investors have shown a willingness to buy dips in the U.S. stock market despite some concern over stretched valuations and market fragility. The S&P 500, Nasdaq Composite
COMP,
and Dow Jones Industrial Average
DJIA,
indexes all closed July 26 at record highs, adding to a long string of new peaks this year, and were trading up Thursday afternoon.
Meanwhile, Citigroup analysts said in a research note earlier this month that the portion of companies in the S&P 500 that “soundly” beat the stock market benchmark saw a steep drop in the second quarter. And Wells Fargo Investment Institute said in a June 30 report that “an examination of market breadth reveals a narrowing of stocks carrying the major indexes to record highs over the last three months.”
The S&P 500 is top-heavy.
Five tech giants — Apple Inc.
AAPL,
Microsoft Corp.
MSFT,
Alphabet Inc.
GOOGL,
Amazon.com Inc.
AMZN,
and Facebook Inc.
FB,
— represented about 23% of the market-capitalization-weighted index at the end of last week, MarketWatch’s sister publication Barron’s reported July 26.
Meanwhile, Value Line covers about 90% of total U.S. stock market value, according to a product guide on its website. While Instinet’s Cappelleri said he doesn’t closely follow the equally-weighted Value Line Geometric index, he pointed to the Invesco S&P 500 Equal Weight ETF
RSP,
whose performance has “flatlined” over the past three months.
Still, the Invesco S&P 500 Equal Weight ETF was trading around record highs on Thursday afternoon, FactSet data show.
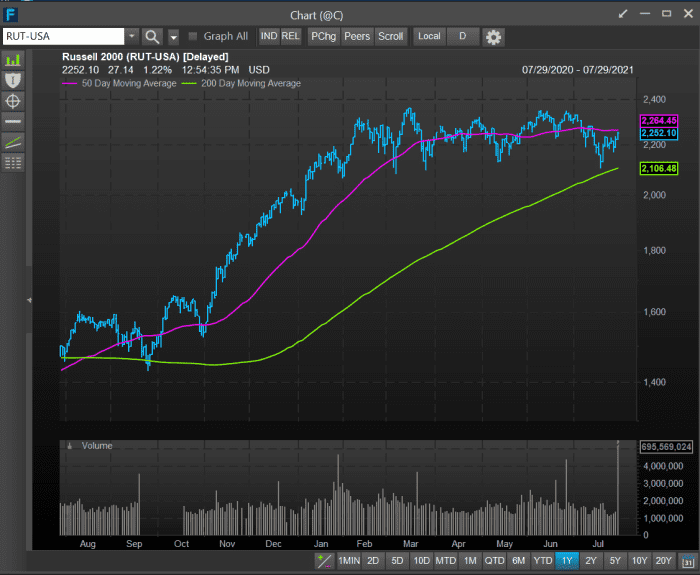
In the world of small-cap stocks, the Russell 2000 index
RUT,
remains below its March peak, according to FactSet. The index has struggled this month, with the small-cap index down about 2.8% so far for July, based on Thursday afternoon trading, FactSet data show, at last check.
“There’s skepticism of the sustainability” of the upward trajectory of U.S. stocks, partly due to concerns about a lack of market breadth, Katie Stockton, founder of Fairlead Strategies, said in an interview. But in her technical analysis, Stockton sees no “big sell signals” or “major signs of upside exhaustion” in big tech.
U.S. stocks have put up big gains in 2021.
The S&P 500 has risen almost 18% this year based on Thursday afternoon trading, according to FactSet. The Russell 1000 Growth
RLG,
and Russell 1000 Value
RLV,
indexes have each risen around 17% this year, FactSet data show, with the tug-of-war now being about even.


