This post was originally published on this site
Shares of Twitter Inc. have run into some technical headwinds, as their recently record rally hasn’t quite turned the chart outlook bullish, yet.
The social media app’s stock
TWTR,
ran up as much as 9.2% intraday before pulling back to be up 2.8% in afternoon trading Tuesday, after the the company named Tesla Inc.’s
TSLA,
“Technoking” Elon Musk as a board member. That followed a 27.1% rocket ride on Monday, the biggest one-day gain in Twitter’s public history, after it was disclosed that Musk made a large equity investment in the company.
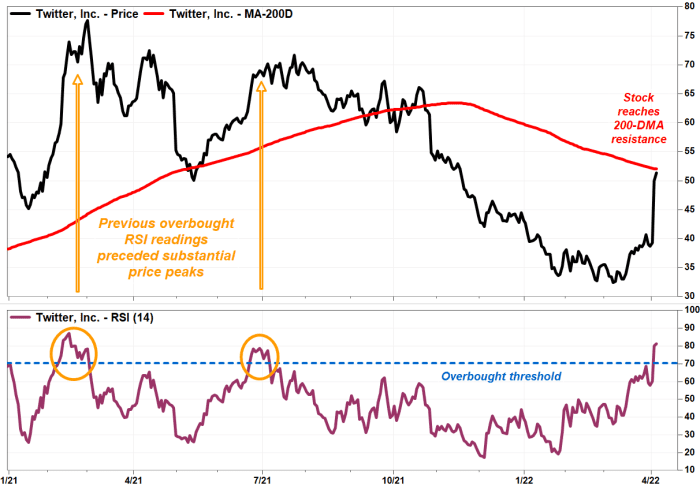
But even with the stock trading about 58% above the 20-month closing low of $32.42 on March 7, it was still on track to close below the 200-day moving average (DMA), which many Wall Street technicians view as a dividing line between longer-term uptrends and downtrends. The stock’s 200-DMA extended to about $52.03 on Tuesday, according to FactSet.
Also providing a reason for caution, the two-day rally has produced the most overbought reading since just before the stock peaked 14 months ago.
The stock’s Relative Strength Index (RSI), a momentum indicator that tracks the magnitude of recent gains against the magnitude of recent declines, spiked up to 81.16 on Tuesday, according to FactSet. Many chart watchers believe readings above 70 imply overbought conditions.

FactSet, MarketWatch
The last time the RSI topped the 80 level was Feb. 16, 2021, or a little over a week before the stock closed at a record $77.63 on March 1.
While overbought conditions aren’t necessarily good market timing tools, as previous RSI peaks showed, they can warn investors that further upside might be limited, at least in the near term. Read more about how to interpret RSI readings.
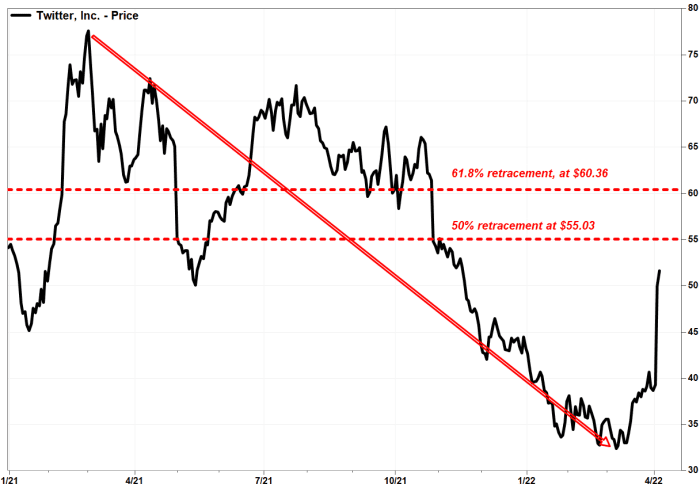
Another technical calculation showing that the stock’s rally remains under a bearish cloud is that it has yet to recover half of what it lost during its bear-market selloff over the past year.
The stock has only retraced 41.9% of the decline from the February 2021 record close to the March 2022 low. The 50% retracement of that 58.2% selloff comes in at $55.03. But the more important retracement level of 61.8% is at $60.36.

FactSet, MarketWatch
Wall Street followers of the Fibonacci ratio of 1.618, also known as the “golden” or “divine” ratio, believe retracements that stay with 61.8% remain governed by the previous trend.
Meanwhile, the stock’s headwinds aren’t all technical in nature.
MKM Partners’ fundamental analyst Rohit Kulkarni downgraded Twitter to neutral, after being at buy January 2021, while keeping his stock price target at $49.
“While we are excited and intrigued at the prospect of Elon Musk taking a potentially active role at growing Twitter, we believe the near-term risk/reward is fairly balanced at current levels,” Kulkarni wrote in a note to clients.
Given that Twitter is currently blocked in Russia, any softness in brand advertisers’ spending in Europe could weigh on the company’s first-quarter results and its second quarter outlook. The company’s next earnings report is projected to be released in late April.
If it does lead to weak results and guidance, Kulkarni views “high-$30s” as probable downside on a pullback.
While Twitter’s stock is now up 18.8% year to date, it is still down 20.1% over the past 12 months. In comparison, the S&P 500 index
SPX,
has slipped 4.9% this year but has gained 11.2% the past year.


