
This post was originally published on this site
A short-term moving-average crossover followed closely by some on Wall Street has appeared on the S&P 500 index’s chart on Thursday, and could spark increased share repurchase activity.
And this bullish technical signal comes after the latest data showed short selling had increased during the recent pullback, to reach levels seen a year ago before a long rally was kicked off.
After the S&P 500
SPX,
ran up 4.3% amid a six-day win streak to close Wednesday just shy of a record, the index had retraced nearly all of the 5.2% selloff suffered last month.
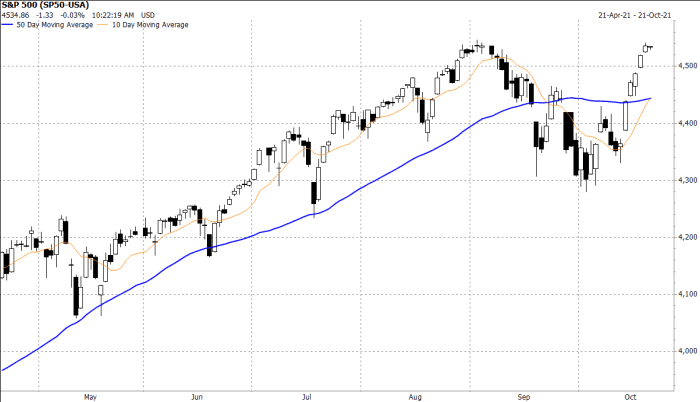
With the index’s bounce, the 10-day moving average (DMA) rose to 4,445..45 in morning trading Thursday, to cross above the 50-DMA, which extended to 4,443.49. That snapped a 21-day streak in which the 10-DMA was below the 50-DMA.
The last bullish crossover occurred on Nov. 10, 2020, when the S&P 500 closed at 3,545.53.
FactSet
“In the past few years, we have noted that Wall Street buyback desks tend to boost their activity after the stock market pulls back, then begins to bounce such that the 10-day moving average crosses above the 50-day moving average,” wrote Brian Reynolds, Chief Market Strategist at Reynolds Strategy, and a long-time veteran of the credit markets, in recent note to clients.
The S&P 500 rose 0.1% and the Nasdaq Composite
COMP,
gained 0.4% in morning trading, as both indexes reversed earlier losses of 0.2%.
This bullish crossover comes after the latest exchange data showed that overall short interest in the stock market, which are bets that share prices will fall, have climbed back to levels seen about a year ago, which is the last time the market underwent a significant pullback.
Also read: Short sellers are not evil, but they are misunderstood.
“The best time for a buyback desk to put their money to work is in a situation were in now. And buyback desks have so much money to put to work,” Reynolds told MarketWatch. “The same situation unfolded last year.”
Short interest on the Nasdaq was 8.74 billion shares at the end of September, up from 8.63 billion in mid-September, and above the 8.38 billion shorted shares at the same time a year ago.
On the NYSE, short interest rose to 11.75 billion shares as of Sept. 30, up from 11.65 billion shares on Sept. 15, and has now recovered to last September’s levels, Reynolds said.
Exchanges will next publish short interest data on Oct. 26.
Reynolds said he believes the recent market set up suggests “buybacks and short selling are on a collision course,” as happened many times during the 11-year bull market that preceded the pandemic, and could to lead to another round of forced short covering into the winter.
“As was the case last year, this short covering could last for months,” Reynolds said. “If retail investors participate, stock prices have the potential to rise rapidly, though such a rise would likely prompt a slowing in buyback activity early next year, to try to help moderate this bull market.


