
This post was originally published on this site
It is the unbearable lightness of being for the S&P 500 index.
The broad-market measure of a basket of 500 U.S. stocks has been preternaturally resistant to pullbacks of late, despite concerns about the spread of the highly transmissible delta variant of COVID-19 and worries that the Federal Reserve’s strategy to reduce its bond purchases may be be ill-timed.
Yet, the S&P 500 index
SPX,
has seen a largely uninterrupted ascent to such a degree that this Friday, absent a sharp sell off, will mark the 200th session without a drawdown of at least 5% from its recent peak, making the current stretch of levitation the longest such since 2016, when the market went 404 sessions without falling by at least 5% peak to trough.
| Start data | End date | S&P 500 Gain During Streak | Days Without a 5% Pullback |
| Aug. 19, 1998 | Sept. 8, 1959 | 22.2% | 266 |
| Jan. 4, 1961 | Jan. 9, 1962 | 20.1% | 255 |
| Nov. 26, 1993 | June 8, 1965 | 23.4% | 386 |
| Oct. 12, 1992 | March 28, 1994 | 14.2% | 370 |
| Dec. 21, 1994 | July 12, 1996 | 41.4% | 394 |
| Oct. 21, 2014 | Aug. 20, 2015 | 6.9% | 210 |
| June 28, 2016 | Feb. 2, 2018 | 38.1% | 404 |
| Nov. 4, 2020 | Aug. 20, 2021 | 200* (assuming no fireworks on Friday) | |
| Source: Dow Jones Market Data |
It is extremely rare for the market to enjoy such a period of relative effervescence. Indeed, such lengthy stretches without a 5% pullback or better have occurred on only eight occasions in the S&P 500 index, the attached table shows.
There clearly are reasons why the market is clambering higher in the recovery from COVID, set against a daunting wall of worry. Investors are jockeying between areas of the market that are expected to boost revenue and profit faster than the rest of the pack and those that are beaten down and might benefit from a fuller economic rebound from coronavirus.
Check out: Delta variant is creating cascade of reasons to question U.S. recovery in the second half
Buying on Monday helped the Dow Jones Industrial Average
DJIA,
and the S&P 500 index
SPX,
produce their 35th and 49th record all-time closing highs of 2021, respectively. Meanwhile, the Nasdaq Composite Index
COMP,
stands a little over 2.5% from its record high put in on Aug. 5.
There is, of course, a sense that the party for stocks can’t last forever.
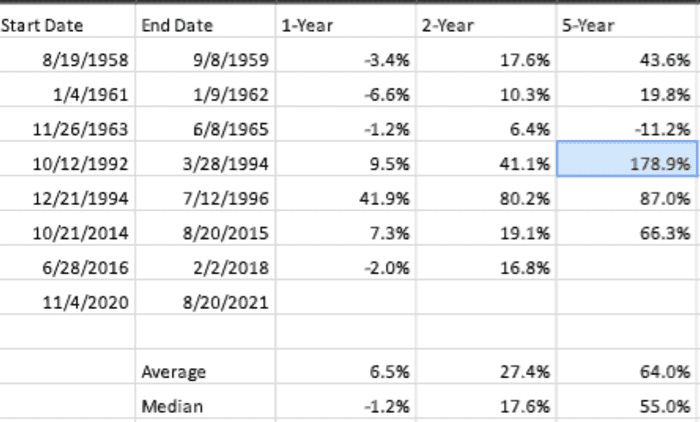
So, how does the market tend to perform in period after such a protracted bullish run?
The data set is very small but the S&P 500 has mostly climbed on a median basis, falling 1.2% in the following year but producing a median gain of 17.6% in a two-year period and 55% in the ensuing five-year period. The mean average return is better, showing a gain of 6.5%, 27.4% and 64%, respectively.
Dow Jones Market Data

