
This post was originally published on this site
The S&P 500 index was poised to exit market-correction territory Tuesday, a move that has tended to point to near- and medium-term gains for the U.S. large-cap benchmark in the past.
The S&P 500
SPX,
was up 1.2% near 4,632 in afternoon trade. A close above 4,587.77 would mark a 10% rise from the index’s March 8 close at 4,170.70, according to Dow Jones Market Data. The S&P 500 fell into a market correction on Feb. 22, when it finished more than 10% below its Jan. 3 record close.
A market correction is defined as a fall of 10% but less than 20% from a recent peak. A decline of 20% or more marks a bear market. Under the definition used by Dow Jones Market Data, an asset doesn’t exit a correction until it rises 10% from its correction low.
The table below, which excludes periods when a correction turned into a bear market, maps out how the S&P 500 has tended to perform after exiting:
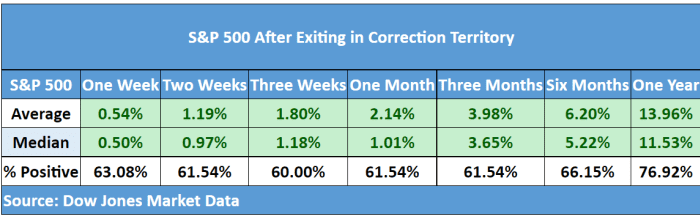
Dow Jones Market Data
Based on data going back to 1928, the S&P 500 has seen a median gain of 11.5% a year after exiting correction, and average gain of nearly 14% — rising nearly 77% of the time. Median and average returns for shorter term time frames were also positive.
U.S. stocks stumbled early in the new year as the Federal Reserve signaled it would be more aggressive than previously expected in raising interest rates and otherwise tightening monetary policy in reaction to inflation running at a nearly 40-year high. The S&P 500 entered correction territory just ahead of Russia’s Feb. 24 invasion of Ukraine and set its closing low on March 8.
Stocks have subsequently bounced as the war continued and as the Fed has signaled it will move quickly and aggressively, with Fed Chairman Jerome Powell opening the door to half percentage point rate increases in the future rather than quarter-point moves.
Equities rose Tuesday as the 10-year Treasury yield briefly traded below the 2-year yield, temporarily inverting a measure of the yield curve that is viewed as a reliable recession indicator, though stocks have tended to hold up in the immediate to medium-term wake of past inversions, data show.
The Dow Jones Industrial Average
DJIA,
was up around 320 points late Tuesday, a gain of 0.9%, while the Nasdaq Composite
COMP,
which fell into a bear market earlier this year, was up 1.9%.

