
This post was originally published on this site
Something unusual is happening in the market for copper that hasn’t been seen in nearly 30 years. Some see it as yet another sign that the global economy could be headed for a rough patch.
Declining prices in the spot market for copper have pushed the spread between the spot price and the price of futures traded on the London Metals Exchange for delivery three months out to its widest level since 1994, putting the copper futures curve into a state of extreme contango — a term used by commodity futures traders to describe when futures prices are trading in excess of the spot price.
Prices have been declining over the past few months as inventories have piled up at London Metals Exchange warehouses around the world.
Falling demand is largely a factor of weakness in the Chinese economy, analysts say. But given that China’s economy is the world’s second largest, the ripple effects could be felt as far away as Europe, the U.S. and beyond.
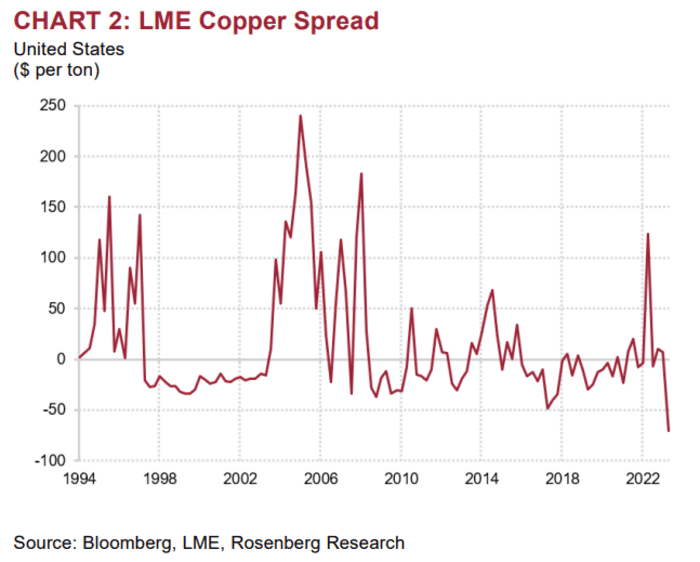
ROSENBERG RESEARCH
According to the latest data from LME, 163,900 tonnes of copper are being stored in exchange warehouses around the world as of Sept. 22. That’s an increase of 50% since the start of September, following a 50% increase during the month of August. Inventories have been rising since mid-July, data show.
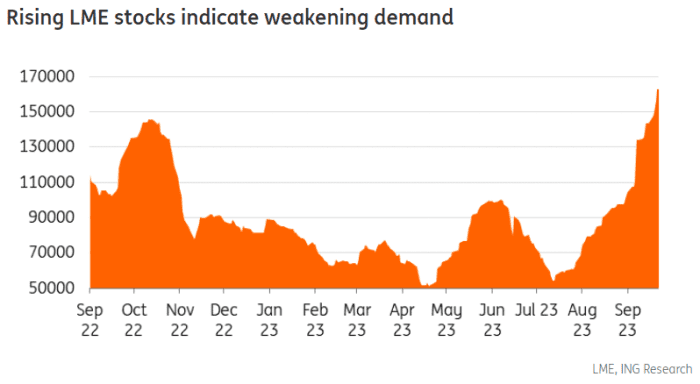
ING
The implication is clear, commodity analysts say.
“This shows clear signals of weakening demand,” said Ewa Manthey, a London-based commodity strategist at ING, in a note to clients. To be sure, Manthey noted that inventories remain low by historical standards.
Dave Rosenberg, a former Merrill Lynch economist who is now runs Rosenberg Research, also blamed weakening economic conditions in China for the slump in copper prices.
He also noted that prices could be reacting to a decline in global trade.
Trade fell 3.2% on a year-over-year basis in August, the steepest drop since August 2020, according to the latest figures from the World Trade Monitor, which is published by the Netherlands Bureau for Economic Policy Analysis.
Typically, declining trade activity is a sign of declining economic activity more broadly.
For years, copper has enjoyed the sobriquet “Dr. Copper,” supposedly for its ability to sniff out global economic trends before they’re reflected in the official data. Copper has a variety of uses in industrial and medical products, to the electric wiring in homes, along with roofing, plumbing and beyond. It’s one of the most commonly used industrial metals.
But some analysts have recently questioned copper’s predictive potential. Bank of America’s commodity research team led by Michael Widmer and Francisco Blanch said copper’s sensitivity to GDP growth has waned in a research note published last month.
“As a cyclical asset, copper demand has always been closely correlated with global GDP growth, but that sensitivity has been declining,” the Bank of America team said. “This reduced beta to GDP has already provided support to copper prices at around $8,500/t ($3.86/lb) in recent quarters and limited downside price pressures on the red metal in the midst of an industrial recession, a rare occurrence,” they add.
Copper prices for December delivery
HG00,
HGZ23,
trading on the New York Mercantile Exchange, which competes with LME, were off 0.7% at $3.65 a pound on Tuesday, hovering around their lowest level since late May, according to FactSet data.

