
This post was originally published on this site
November likely will be a good month for the Dow Jones Industrial Average
DJIA,
which can be expected to gain 0.6%, or about 220 points.
Such an advance would take the U.S. stock market bellwether to around the 36,040 level, versus the 35,820 level at which it finished the month of October. Were you hoping for more? After all, the Dow rose almost 6% in October.
You shouldn’t be surprised. The Dow’s expected November gain is the same as for every other month of the calendar. There is no reason for November to be any better or worse than the historical average.
It’s important to point this out to counter those on Wall Street who mine the historical data in search of “uncanny” seasonal patterns. The only real investment lesson we can learn from their efforts is that if you torture the data long and hard enough you can make it say almost anything.
Consider the claims that the chief investment officer of a major Wall Street firm emailed to clients last week: “November has been quite strong historically. In fact, since 1950, and the past 10 years, it is the best month of the year, while it ranks second over the past 20 years and during a post-election year. November is the best month of the year, but it doesn’t seem to get nearly as much love as you’d think. We all assume December is the best month, but November is actually better and gets very little fanfare.”
This raises several red flags. Why choose the period since 1950, as opposed to, say, 1960 or 1940? Why focus on just the past 10- or 20 years and not the past 13 or 23 or 27?
Unless there is a compelling theoretical reason to focus on a subset of the historical data, doing so suggests that deliberate data mining is going on.
The Dow offers investors monthly data extending back to its creation in May 1896. Over the ensuing 125 years, November’s average return ranks 5th for all years, as you can see in the chart below. November is slightly above average, but not at the 95% confidence level that statisticians often use when determining if a pattern is genuine. In fact, it isn’t even close.
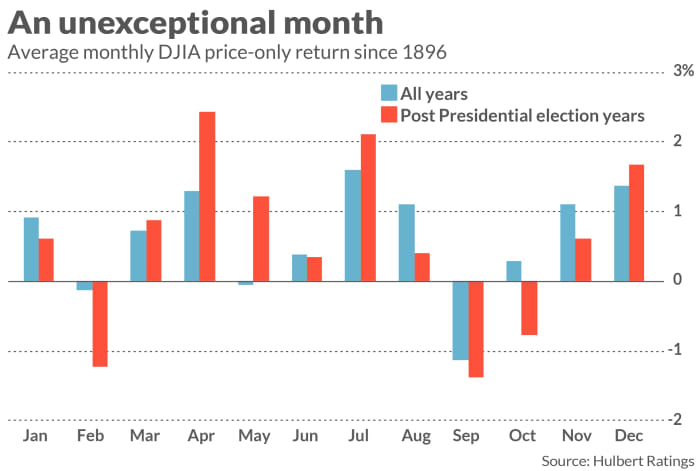
How about November being the second-best month in post-presidential election years? Again, this is true for only one subset of the historical data. Viewed over the Dow’s entire history, November is in 6th place for average performance during post-presidential election years. In other words, its performance rank in such years is actually slightly worse than in the entire sample.
I don’t mean to pick on this particular well-known Wall Street CIO, which is why I am not naming him. He actually is in good company.
Playing the odds
There’s an even more fundamental problem with this data mining, beyond their lack of statistical significance: To get historical odds reasonably in your favor when betting on a seasonal pattern, you would have to bet on it consistently many times in a row — several dozen at a minimum. So when betting on a pattern that comes around only once every year, the intelligent bet lasts several decades. The odds of success in any given year are only barely above a coin flip.
In all Novembers since 1896, for example, the Dow has risen 63% of the time. Even assuming the future will be like the past, a bet that the stock market will gain ground in November will be wrong slightly more than one out of every three years. That’s far too much risk to justify throwing caution to the wind.
Ideally, from a statistical point of view, you can find statistically significant patterns that are extremely short term. That would allow you, with even a relatively brief holding period, to bet on those patterns a sufficient number of times to get the odds decently in your favor.
This, for example, is the secret behind the phenomenally successful Medallion Fund, from Renaissance Technologies, which (even after fees) beat the S&P 500
SPX,
between 1988 and 2018 by the incredible margin of 39.2% annualized return to 10.0%. (The fund is not available to outside investors.)
Brad Cornell, a professor emeritus at UCLA, reports that the odds of success of any of Medallion Fund’s individual trades have been 50.75%, only slightly higher than 50%. But when coupled with high-frequency trading, those odds are enough to produce a highly profitable strategy. Medallion’s “strategy involved constantly opening and covering thousands of short-term positions, both long and short… Taken over millions of trades that [50.75%] percentage allowed the firm to make billions,” Cornell wrote.
Remember this the next time you read about an alleged seasonal pattern in the stock market. Even when that pattern is statistically significant, which is rare, it won’t help you much over the long term.
Mark Hulbert is a regular contributor to MarketWatch. His Hulbert Ratings tracks investment newsletters that pay a flat fee to be audited. He can be reached at mark@hulbertratings.com
Also read: Put these 10 stocks on your radar because they may rebound from recent tax-loss selling
More: Higher inflation will push Americans back to work and cool speculative markets

