
This post was originally published on this site
I have discovered a stock-market timing model with a track record that’s even better than the famous Super Bowl Predictor.
Before I share that new model with you, let me remind you of what the Super Bowl Predictor is. It predicts that the U.S. stock market will rise for the rest of the year if the game’s winner traces its roots to the original National Football League before its merger with the American Football League in 1966 — and fall if the winning team can trace its roots back to the A.F.L.
Devotees claim that the Super Bowl Predictor has an uncannily successful track record. If they’re right and it holds up this year, the stock market will rise between the Super Bowl on Feb. 13 and the end of the year if the Los Angeles Rams are the winner. If instead the Cincinnati Bengals are victorious, the stock market should fall.
As far as my research has been able to determine, the Super Bowl Predictor traces to an article by Leonard Koppett, a baseball Hall-of-Famer and sports writer, that appeared in the February 1978 issue of The Sporting News.
Ready for my model that does even better? Simply bet that the stock market will go up. That’s it.
You might think I’m joking, since always betting the market will rise is hardly a model. Nevertheless, as I will show below, this “model” has a track record that is markedly higher than the Super Bowl Predictor.
Real time test since 1978
To calculate the Super Bowl Predictor’s track record, I must focus only on the years since 1978. That’s because it’s a statistical imperative to calculate its track record only in real time, after it was first discovered. Otherwise the results are tainted by so-called hindsight bias.
Since 1978, according to my calculations, the Super Bowl Predictor has been right 50% of the time. That’s precisely what you would expect if the indicator were worthless — no better than a coin flip.
My simple model, in contrast, has been right 80% of the time since 1978.
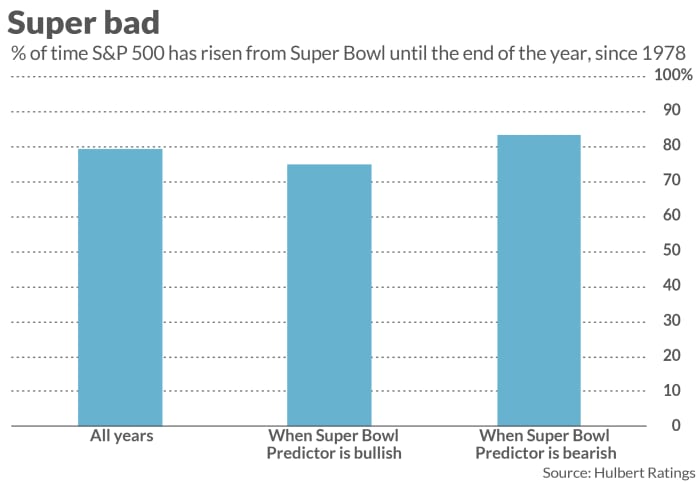
The chart above helps us understand why the Super Bowl Predictor’s success rate hasn’t been better. In those years since 1978 in which the Super Bowl Predictor was bullish, the S&P 500
SPX,
rose 75% of the time between then and the end of the year. Not bad. But the S&P 500 rose even more frequently in years in which the indicator was bearish — 83% of the time, in fact. That means that, in those years, the Super Bowl Predictor was right just 17% of the time.
You shouldn’t be surprised by the Super Bowl Predictor’s disappointing real-time record. Koppett himself introduced it as a joke. Before he died in 2003, Koppett wrote that the indicator was an “embarrassment,” and it would be a “relief” if it could be declared “dead as a doornail.”
The bottom line? The odds the stock market will rise this year essentially the same regardless of who wins the Super Bowl. If you want to bet on a stock market outcome, bet that the market will be higher at year’s end than where it stands on Super Bowl Sunday — regardless of who wins the big game.
Mark Hulbert is a regular contributor to MarketWatch. His Hulbert Ratings tracks investment newsletters that pay a flat fee to be audited. He can be reached at mark@hulbertratings.com
More: Bitcoin is powerful but can it predict Nasdaq and S&P 500 corrections and rallies?
Also read: Invest in Google if you like — but that stock split isn’t a solid reason to be bullish
