
This post was originally published on this site
Don’t be too quick to sell the stocks that have performed the worst so far this year, since they are likely to be among the U.S. market’s best performers in January.
That’s because those loser stocks will be subjected to two different sources of artificial selling pressure in coming weeks, neither of which has anything to do with fundamentals or earnings potential. That pressure comes to an end on Dec. 31, which is why these stocks are likely to bounce back in a big way in January.
One source of selling pressures is end-of-year window dressing, in which portfolio managers sell their losers in order to avoid the embarrassment of having to list them in their end-of-year reports. The other is tax-loss selling, in which investors sell some of the stocks they’re holding at a loss in order to offset some of the capital gains taxes they will have to pay in 2024.
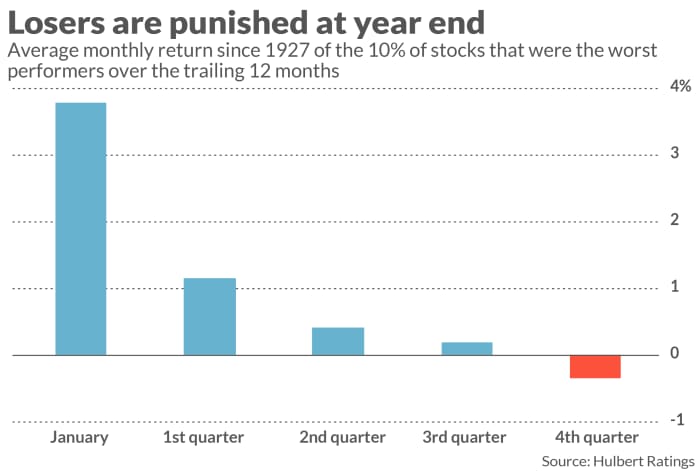
The chart below illustrates this January bounce-back pattern, based on data since 1927 (courtesy of Dartmouth College’s Ken French). It plots the return of a hypothetical portfolio that, each month, invests in the 10% of stocks with the worst trailing-year returns. Notice that the strongest average returns are in January and the worst at the end of the year.
To exploit this pattern, start by looking through a list of the biggest year-to-date losers. Pick out a handful that attract you, and place buy orders on them at prices well-below where they’re currently trading. If you’re lucky, year-end window dressing and tax-loss selling will depress prices enough that a few of your orders are filled. Come January you stand a good chance of pocketing some outsized gains.
I illustrated this approach a year ago by taking the 10% of S&P 1500 stocks with the worst year-to-date performance and narrowing the list to include just those that were also recommended by any of the investment newsletters my firm monitors. The 20 stocks that survived this winnowing process gained 21.8% in January of this year, on average, far outpacing the S&P 500’s
SPX
6.3%.
The list below repeats this process with this year’s list of worst year-to-date performers in the S&P 1500 so far this year. Each of the following is recommended by at least one of the investment newsletters by firm monitors.
| Stock | YTD return (thru 10/20) |
| Advance Auto Parts, Inc. (AAP) | -64.5% |
| First Horizon Corporation (FHN) | -55.3% |
| Moderna, Inc. (MRNA) | -55.2% |
| Dollar General Corporation (DG) | -52.7% |
| AES Corporation (AES) | -50.9% |
| Methode Electronics, Inc. (MEI) | -46.0% |
| Newell Brands Inc (NWL) | -45.1% |
| Estee Lauder Companies Inc. Class A (EL) | -44.1% |
| Macy’s, Inc. (M) | -42.6% |
| Northfield Bancorp, Inc. (NFBK) | -42.5% |
| Premier, Inc. Class A (PINC) | -42.2% |
| Concentrix Corporation (CNXC) | -41.8% |
| UGI Corporation (UGI) | -41.7% |
| Sealed Air Corporation (SEE) | -40.9% |
| Illumina, Inc. (ILMN) | -40.8% |
| Walgreens Boots Alliance, Inc. (WBA) | -40.4% |
| Comerica Incorporated (CMA) | -40.4% |
| KeyCorp (KEY) | -40.3% |
| Foot Locker, Inc. (FL) | -39.5% |
| Bank of Hawaii Corp (BOH) | -38.7% |
Mark Hulbert is a regular contributor to MarketWatch. His Hulbert Ratings tracks investment newsletters that pay a flat fee to be audited. He can be reached at mark@hulbertratings.com
More: JPMorgan’s Dimon and BlackRock’s Fink both see parallels to the 1970s

