
This post was originally published on this site
Last week’s unexpected plunge in the University of Michigan Consumer Sentiment Index is actually good news for U.S. stock investors. That’s because the American consumer is a contrarian stock-market indicator. More often than not over the past four decades, large declines in consumer confidence have been followed by above-average stock market returns.
This should come as a big relief for Wall Street bulls, who have otherwise been fretting about the University of Michigan index’s latest reading. From a July level of 81.2, the index fell last week to 70.2. That’s the lowest since December 2011 — lower even than the lowest reading registered in the darkest early weeks of the COVID-19 pandemic.
To appreciate how much this latest reading was unexpected, consider that the economists surveyed in advance by MarketWatch were predicting, on average, that the index would come in at 81.3 — a slight right rise from the July number.
To analyze the significance of drops as big as this latest one, I calculated the correlations between monthly changes in the University of Michigan index since 1978 and the S&P 500’s
SPX,
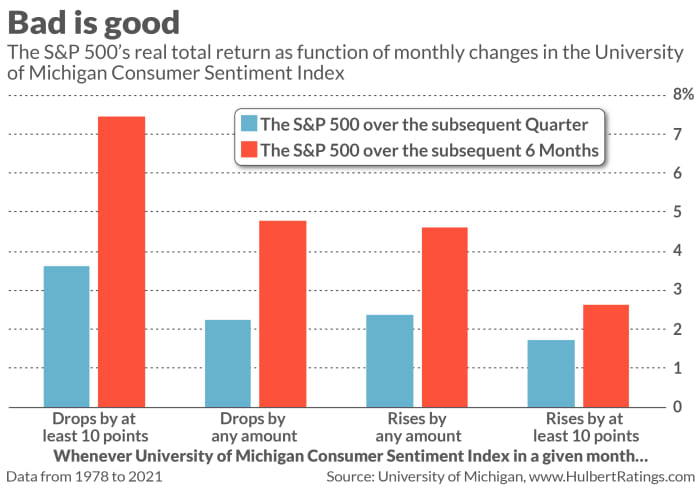
subsequent performance on both an inflation- and dividend-adjusted basis. I found that whenever this sentiment index dropped by at least 10 percentage points, the S&P 500 over the subsequent three months gained an average of 3.6%.
That’s double the 1.7% average three-month gain following months in which the consumer sentiment index gained at least 10 percentage points. Moreover, as evident in the chart below, this contrast at the six-month horizon is even greater: 7.5% versus 2.6%.
To be sure, there aren’t that many months since 1978 in which the consumer sentiment index rose or fell by this much. The inverse relationship between the sentiment index’s monthly changes and the U.S. stock market’s subsequent performance is only marginally statistically significant. So you should not use the occasion of the sentiment index’s big drop to throw caution to the wind.
Nevertheless, if you want to believe that this historical relationship is statistically insignificant, you still can’t conclude that this most recent drop is a bad sign. You’d instead have to conclude that the University of Michigan index tells you nothing about the stock market’s prospects in coming months.
So there you have it. Either this latest drop means nothing, or it is bullish. If you want to believe that this latest drop is bad news, you will have to base your argument on something other than U.S. stock market history since 1978.
Mark Hulbert is a regular contributor to MarketWatch. His Hulbert Ratings tracks investment newsletters that pay a flat fee to be audited. He can be reached at mark@hulbertratings.com
Also read: Why stocks still suffer bear markets even when the U.S. economy is growing


