
This post was originally published on this site
The U.S. stock market, as measured by the S&P 500 Index
SPX,
is trapped in a trading range, and volatility seems to be damping down considerably. The significant edges of the trading range are support at 4330 and resistance at 4540. Both of those levels were touched in the latter half of August. A breakout from this range should give the market some strong directional momentum.
Since Labor Day, prices have hunkered down into an even narrower range. Typically, the latter half of September through the early part of October is a seasonally bearish period, but price action has not begun to reflect that so far. Still, market internals are much more negative than the market itself.
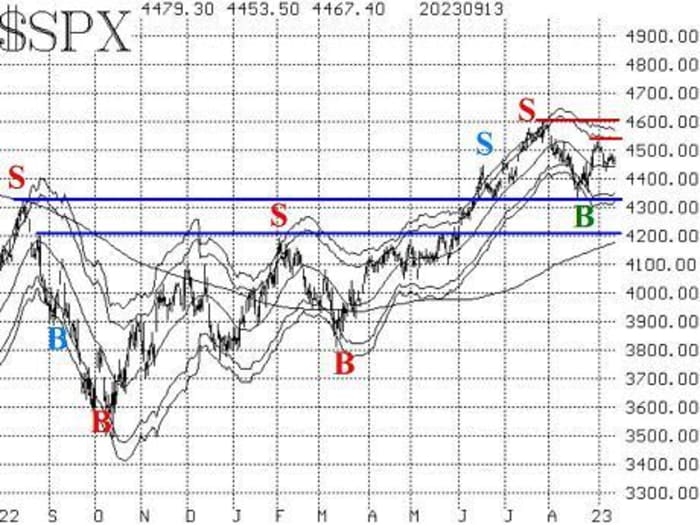
The McMillan Volatility Band (MVB) buy signal (green “B” on the accompanying SPX chart) is still in place. Its target is the +4σ Band, which is currently at 4570 and drifting sideways. That buy signal would be stopped out if SPX were to close below the -4σ Band, which is just above 4300 and also moving sideways.
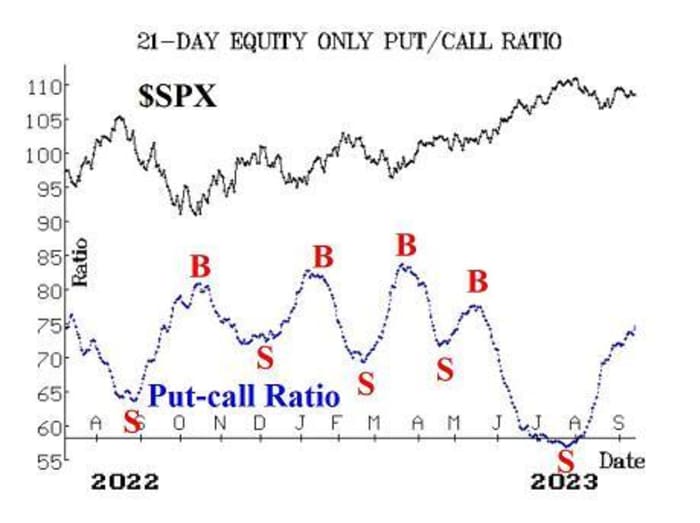
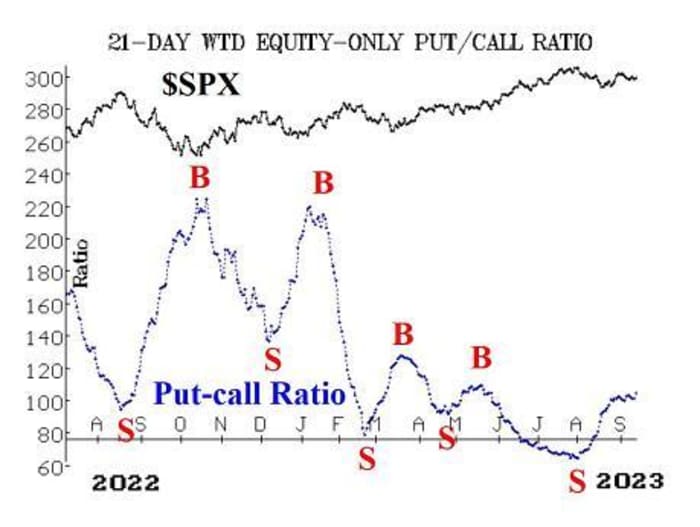
Earlier this week, equity-only put-call ratios appeared to be rolling over, which would have led to buy signals. But that did not happen. There was heavy put buying on September 13th, and both ratios jumped higher — to new relative highs on their charts — and the sell signals are thus intact. The total put-call ratio and the CBOE equity-only put-call ratio were both greater than 1.0 on September 13th, which is unusual and is an oversold condition that can produce a very short-term rally. If the CBOE ratio exceeds 1.0 again within the next four trading days, that would be a stronger, intermediate-term buy signal.
Breadth has been fairly negative, and the breadth oscillators have been on sell signals since September 5th. They did not descend into oversold territory, so it would take at least a couple of days of positive breadth to reverse this current negative situation.
New Lows on the NYSE have been hovering near (but mostly just below) 100 for several days now. They exceeded 100 issues on one day — September 7. Even so, this indicator remains neutral, for it would take either New Lows or New Highs to number 100 or more for two consecutive days in order to generate a new signal here. That has not happened.
As noted earlier, the above “market internal” indicators are fairly negative. The opposite is true of the volatility-based indicators, all of which are positive for stocks. VIX
VX00,
continues to hover at or below 14.0, near its yearly lows. Thus, it is trending downward, and that is bullish for stocks. The “spike peak” buy signal of early August has “expired” (the buy signal “expires” after 22 trading days). But the trend of VIX buy signal remains intact. These conditions would only change if VIX were to rise above its 200-day moving average, which is just above 18 and slowly declining.
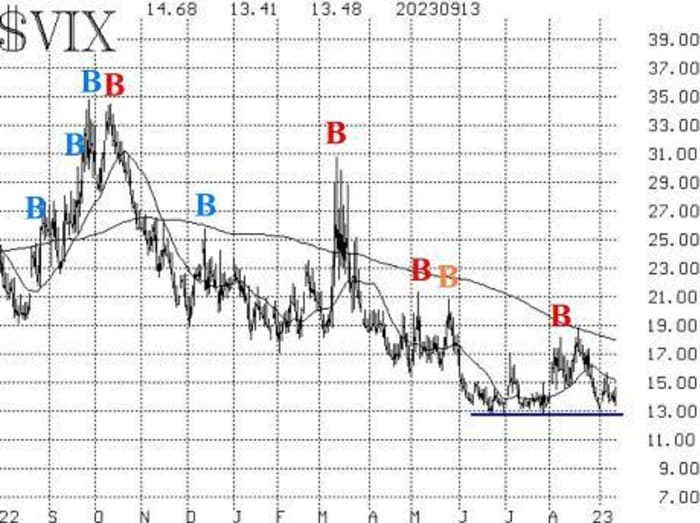
In addition, the construct of volatility derivatives remains in a bullish posture regarding the stock market. The term structures of the VIX futures and of the CBOE Volatility Indices slope upward, and the VIX futures are all trading at healthy premiums to VIX. The September VIX futures are currently the front month. They expire Wednesday, September 20, at which point October will be the front month. The first sign of danger would be if October VIX futures rose in price above November VIX futures.
In summary, we are no longer going to hold a “core” bullish position since SPX is trapped in this trading range. A breakout from the range should change that, as it would provide some momentum for this market. Meanwhile, we will trade the individual signals as they occur, including an upcoming bearish seasonal pattern.
New recommendation: Seasonal trade
The week after September expiration (i.e., the week after the third Friday of September) is historically negative for the market. Last year, that week saw a 180-point decline for SPX — the largest point decline in the 33 years that we have been using this indicator. It was not the largest percentage drop in a week (that occurred in 2011).
On average over those 33 years, SPX has dropped, on average, by 1% over that particular week. For most of the past three years, a 1% move in a week has not been unusual, although it was prior to that. In those 33 years, SPX has dropped 26 times and risen seven times during this week. Other studies show the seasonally negative pattern often extends into October, but we are not looking for that on this trade.
At the close of trading on Friday, September 15, BUY 2 SPY
SPY
Sept (29th) at-the-money puts. NOTE: we are not going to use a spread here, since VIX is low (near 14) and the options are not expensive. The only time it makes sense to use bull- or bear spreads when speculating is when the options are expensive.
If SPX falls 1% from where it was when you established the trade, then sell half of your position. The remainder should be sold at the close of trading on Friday, September 22nd.
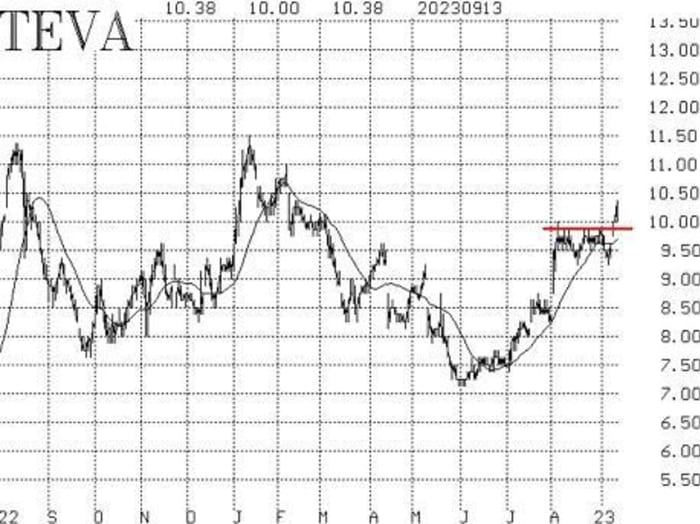
New recommendation: Teva Pharmaceuticals (TEVA)
TEVA
TEVA,
broke out to the upside after having consolidated for over a month. Stock volume patterns are strong, and option volume is heavy as well.
Buy 10 TEVA Oct (20th) 10 calls in line with the market.
TEVA: 10.47 Oct (20th) 10 calls: 0.67 bid, offered at 0.71
Stop out on a close below 9.75.
Follow-up action:
All stops are mental closing stops unless otherwise noted.
We are using a “standard” rolling procedure for our SPY spreads: in any vertical bull- or bear spread, if the underlying hits the short strike, then roll the entire spread. That would be roll up in the case of a call bull-spread, or roll down in the case of a bear put-spread. Stay in the same expiration and keep the distance between the strikes the same unless otherwise instructed.
Long 2 expiring SPY Sept (15th) 456 calls: This is our “core” bullish position. The calls have been rolled several times. Do not roll these calls, since SPX is now in a trading range.
Long 8 expiring CRON
CRON,
Sept (15th) 2 calls: marijuana stocks got a boost after the government decided to call marijuana a low-risk drug. Option volume has been very strong. Roll to the Oct (20th) 2 calls.
Long 0 ORIC
ORIC,
Sept (15th) 7.5 calls: These calls were stopped out on September 13th, since the stock closed below 8.40.
Long 2 expiring EW
EW,
Sept (15th) 77.5 puts: Continue to hold these puts as long as the weighted put-call ratio remains on a sell signal. Roll to the Oct (20th) 75 puts and set a trailing stop to sell these puts if EW closes above 76.
Long 4 SPY Sept (29th) 480 calls: This is the position taken in line with the CVB buy signal. We are holding SPY calls with a striking price equal to SPY’s all-time high. We are holding without a stop.
Long 1 expiring SPY Sept (15th) 448 put and Short 1 SPY Sept (15th) 418 put: Bought in line with the equity-only put-call ratio sell signals. We will stop out of this trade if either equity-only put-call ratio moves to a new buy signal. Since these ratios just reaffirmed their bearish posture, roll this position out to be long-only the Oct (20th) 448 puts, but no longer use a spread.
Long 2 NTAP
NTAP,
Oct (20th) 80 puts: Hold this position as long as the weighted put-call ratio for NTAP remains on a sell signal.
Long 2 EQR
EQR,
Oct (20th) 65 puts: Continue to hold as long as the weighted put-call ratio for EQR remains on a sell signal.
Long 3 expiring X
X,
Sept (15th) 31 calls: The company sent a letter to shareholders saying that it is engaged in a strategic review process. No specifics were provided. We will try this for a few more weeks: roll to the Oct (13th) 31 calls.
Long 2 expiring PSX
PSX,
Sept (15th) 115 calls: There has been no specific news here, but the stock has roared ahead. Roll to the Oct (13th) 123 calls.
Long 1 SPY Oct (20th) 446 call and Short 1 SPY Oct (20th) 464 call: This spread was bought in line with the MVB buy signal of August 29th. This signal will remain in place unless SPX closes below its -4σ Band, which would stop out the signal. The target for the trade is for SPX to touch the +4σ Band.
Long 3 ADM
ADM,
Oct (20th) 82.5 puts: Hold this position as long as the weighted put-call ratio for ADM is on a sell signal.
Long 5 TSHA
TSHA,
Oct (20th) 2.5 calls: Raise the stop to 2.75.
Long 4 BKR
BKR,
Oct (20th) 37 calls: The trailing stop remains at 35.80.
Long 4 DIS
DIS,
Oct (13th) 81 puts: Stop out on a close above 83.70.
All stops are mental closing stops unless otherwise noted.
Send questions to: lmcmillan@optionstrategist.com.
Lawrence G. McMillan is president of McMillan Analysis, a registered investment and commodity trading advisor. McMillan may hold positions in securities recommended in this report, both personally and in client accounts. He is an experienced trader and money manager and is the author of the best-selling book, Options as a Strategic Investment. www.optionstrategist.com
©McMillan Analysis Corporation is registered with the SEC as an investment advisor and with the CFTC as a commodity trading advisor. The information in this newsletter has been carefully compiled from sources believed to be reliable, but accuracy and completeness are not guaranteed. The officers or directors of McMillan Analysis Corporation, or accounts managed by such persons may have positions in the securities recommended in the advisory.
