
This post was originally published on this site
“The buy signals for stocks are still intact.”
The stock market, as measured by the S&P 500 Index
SPX,
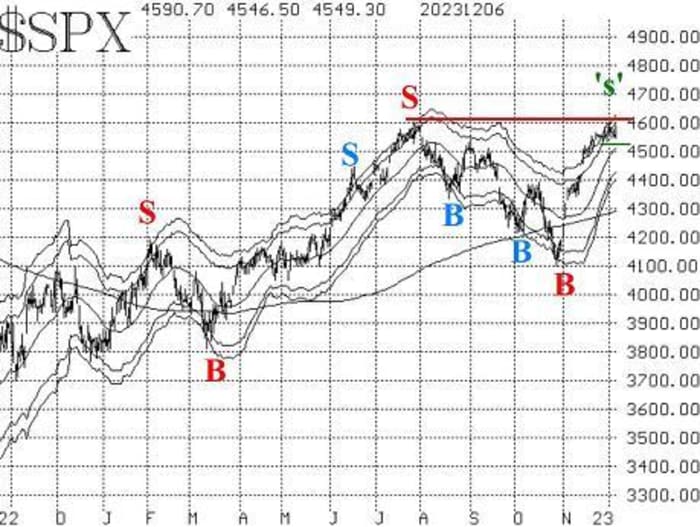
is trying to work off the overbought “hangover” from its huge November rally. So far, it has managed to do so in an orderly fashion. Yes, the rally ran into resistance at the yearly 2023 highs near 4600 on the index, but the pullback from there has been modest. In fact, we have not confirmed any sell signals from our various trading systems yet.
SPX had risen above its +4σ “modified Bollinger Band” (mBB) during the later stages of the rally. Since then, it has pulled back below the +3σ Band, and that created a “classic” mBB sell signal. However, we do not trade those. It is marked as ‘s’ on the accompanying chart of SPX. A confirmed McMillan Volatility Band (MVB) sell signal will occur if SPX pulls back to 4533 (horizontal green line on the chart), but so far that has not happened. Not every “classic” sell signal becomes a confirmed MVB sell signal.
If that sell signal does occur, it would seem that SPX could retreat towards 4400 without causing a great deal of concern. A filling of the gap at 4420 would actually be somewhat beneficial. However, a close below 4400 would be extremely negative and would cause us to abandon the “core” bullish status that is currently in place.
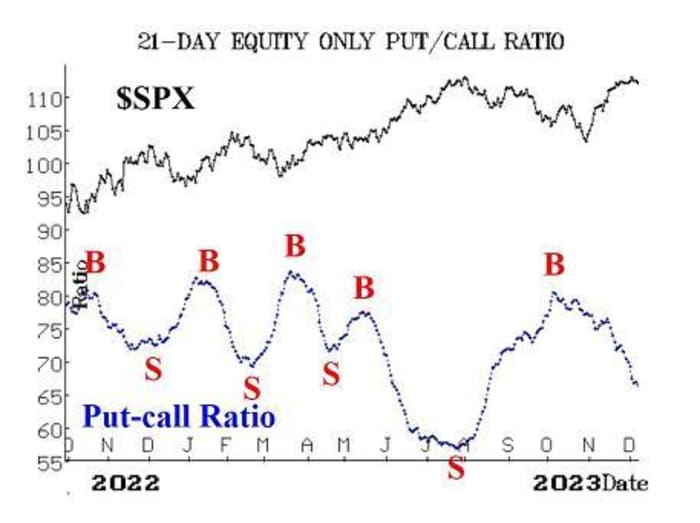
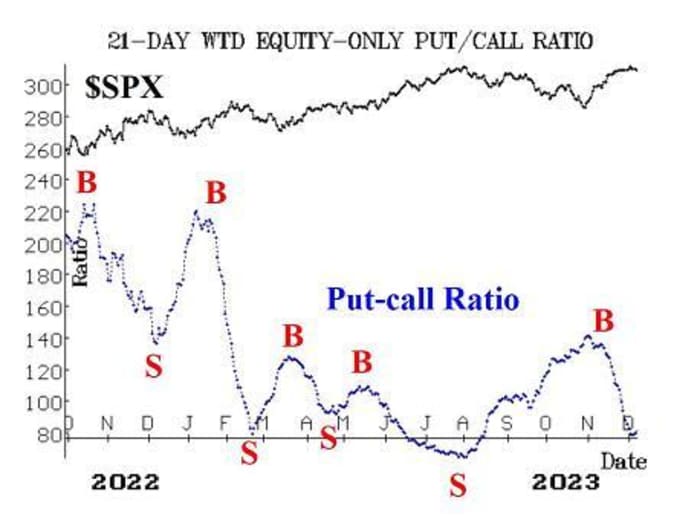
Equity-only put-call ratios continue to decline, and they both remain bullish for the stock market. That will continue to be the case until these ratios bottom out and begin to rise. One can see that there is a small “hook” at the bottom of the weighted chart at the present time, but our computer programs that we use to analyze these charts “say” there is no worry — that the buy signals for stocks are still intact.
Market breadth has been just positive enough to keep our breadth oscillators on buy signals. They are edging lower, though, and even one strong day of negative breadth could conceivably generate sell signals from these oscillators. We require at least a two-day confirmation of any breadth signal, though, so we are not going to act on any new signal immediately.
There has been a new confirmed buy signal this week: New Highs on the NYSE numbered more than 100 for three days in a row. The buy signal occurred at the close on December 1st, (the second consecutive day of more than 100 New Highs).
This buy signal will remain in place until New Lows on the NYSE exceed New Highs for two consecutive days. One might think that this new buy signal is arriving rather late to the game, but back in September, a sell signal from this indicator occurred well after the market had peaked in late July. Even so, the market continued down from there, so the signal was a profitable one. This new buy signal could easily fit in that same mold, so we are going to add to long positions because of this.
VIX
VX00,
VIX
has remained mired at an extremely low level, at or below 14. It recently traded at its lowest level since January 2020. Just because VIX is low is not a sell signal. A sell signal would arise if VIX starts to jump higher from here. So far, that hasn’t happened, and the trend of VIX buy signal that was generated in mid-November is still in place.
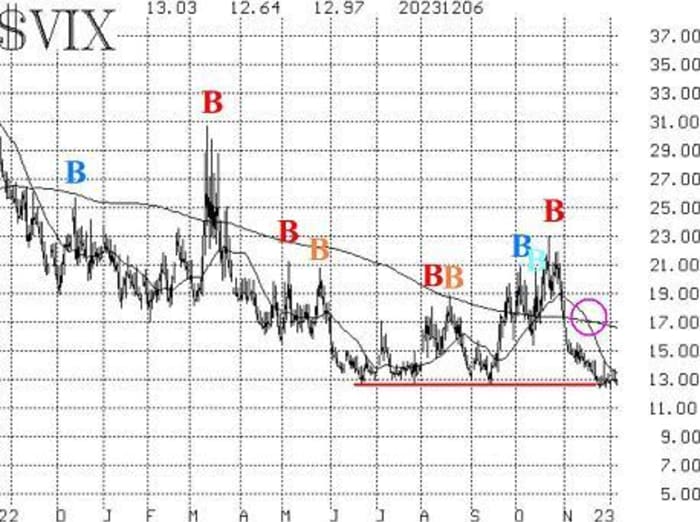
The construct of volatility derivatives remains bullish in its outlook for stocks. The term structures of the CBOE Volatility Indices and of the VIX futures remain upward-sloping. Furthermore, the VIX futures are trading at healthy premiums to VIX. The only entity that is slightly out of line in the term structures is the nine-day volatility Index (VIX9D), which is slightly elevated in front of Friday’s unemployment Report.
Overall, we are maintaining our “core” bullish position, and we will trade other confirmed signals around that. One might have thought that new signals would be sell signals, but the only new confirmed signal that we have is another buy signal — from “New Highs vs. New Lows.”
New buy signal
In the commentary above, we explained that New Highs on the NYSE exceeded more than 100 issues for three consecutive days (and New Highs outnumbered New Lows on each of those days). The second day, December 1st, was enough to generate the buy signal. So, we are adding a relatively long-term call bull spread to our positions, since this is more of an intermediate-term indicator.
Buy 1 SPY Feb (16th) at-the-money call and sell 1 SPY Feb (16th) call with a striking price 20 points higher.
We will stop out of this position if New Lows on the NYSE exceed New Highs for two consecutive trading days. Otherwise, there is no price stop based on SPX.
New recommendation: Potential MVB sell signal
As noted in the market commentary above, SPX had fallen below its +3σ “modified Bollinger Band.” That created a “classic” mBB sell signal. But further confirmation is needed to generate a full-fledged McMillan Volatility Band (MVB) sell signal. Specifically, in this case, SPX needs to trade at 4533 or lower.
IF SPX trades at 4533 or lower, THEN buy 1 SPY Jan (19th) at-the-money put and sell 1 SPY Jan (19th) put with a striking price 20 points lower.
If this position is taken, then the MVB sell signal will have a target of the lower -4σ Band, and it would be stopped out by a close above the +4σ Band. As with all of our spread positions, this one should be rolled (down) if SPX trades at the lower strike.
New put recommendation: Goldman Sachs Group (GS)
We are repeating this recommendation from last week, even though GS
GS,
is slightly higher in price. The put-call ratio is still on a sell signal, and if GS were to break below 329, it would be technical confirmation of that sell signal. Last week’s recommendation follows:
The weighted put-call ratio of GS has generated a sell signal. The stock seems to be having trouble extending recent gains, but that alone is not enough to take a bearish position. However, if it falls below support at 330 and closes the gap there, then the sell signal can be heeded.
IF GS closes below 329, THEN buy 1 GS Jan (19th) 330 put and sell 1 GS Jan (19th) 305 put
GS: 342.38
GS options are not expensive, so this spread should cost about five- or six points. If the position is taken, we will hold as long as the GS weighted put-call ratio is on a sell signal.
Follow-up action:
All stops are mental closing stops unless otherwise noted.
We are using a “standard” rolling procedure for our SPY spreads: in any vertical bull or bear spread, if the underlying hits the short strike, then roll the entire spread. That would be roll up in the case of a call-bull spread or roll down in the case of a bear-put spread. Stay in the same expiration and keep the distance between the strikes the same unless otherwise instructed.
Long 3 XLE Dec (15th) 85 puts: We will hold as long as the weighted put-call ratio of XLE
XLE
remains on a sell signal.
Long 1 SPY Dec (29th) 456 call: This SPY
SPY
spread was bought in line with the CBOE Equity-only put-call ratio buy signal. It has been rolled up several times. Roll the call up if it becomes at least 8 points in-the-money. We are holding without a stop for now.
Long 3 ES Dec (15th) 60 calls: We will hold this position as long as the weighted put-call ratio chart for ES
ES,
remains on a buy signal.
Long 4 XLP Dec (29th) 70 calls: Raise the XLP
XLP
stop to 69.50.
Long 1 SPY Dec (29th) 457 call: This position was initially a long straddle. It was rolled up and the puts were sold. Continue to roll the call up if it becomes 8 points ITM. This is, in essence, our “core” bullish position.
Long 5 AVPT
AVPT,
Dec (15th) 7 calls: The trailing closing stop remains at 7.75.
Long 2 TECH Jan (19th) 60 calls: We will hold as long as weighted put-call ratio is on a buy signal. If TECH
TECH,
trades at 70, roll up to the Jan (19th) 70 calls.
Long 4 KHC Jan (19th) 32.5 calls: We will hold as long as weighted put-call ratio is on a buy signal. If KHC
KHC,
trades at 37.5, roll up to the Jan (19th) 37.5 calls.
Long 2 IWM Jan (19th) 184 calls: This is our post-Thanksgiving seasonal position. We will hold IWM
IWM
without a stop, since this is a rather long seasonal period extending through the first two trading days of 2024. We rolled the call up once. Roll up again if the call becomes six points in-the-money (i.e., at 190).
All stops are mental closing stops unless otherwise noted.
Send questions to: lmcmillan@optionstrategist.com.
Lawrence G. McMillan is president of McMillan Analysis, a registered investment and commodity trading advisor. McMillan may hold positions in securities recommended in this report, both personally and in client accounts. He is an experienced trader and money manager and is the author of the best-selling book, Options as a Strategic Investment. www.optionstrategist.com
©McMillan Analysis Corporation is registered with the SEC as an investment advisor and with the CFTC as a commodity trading advisor. The information in this newsletter has been carefully compiled from sources believed to be reliable, but accuracy and completeness are not guaranteed. The officers or directors of McMillan Analysis Corporation, or accounts managed by such persons may have positions in the securities recommended in the advisory.
