
This post was originally published on this site
The inversion of a closely watched portion of the yield curve in the U.S. Treasury market poses “a new risk” for small-cap stocks, according to BofA Global Research.
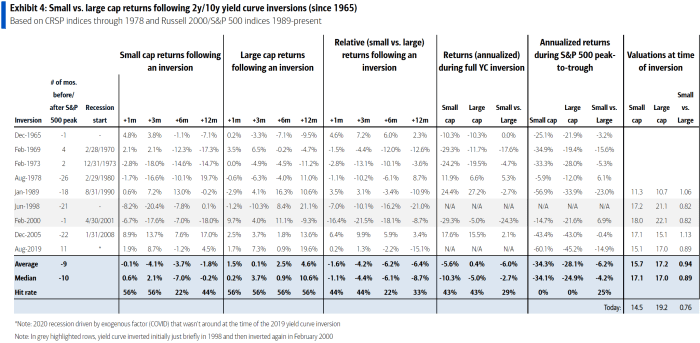
While small-cap stocks tend to be up in the three months following an inversion of two-year and 10-year yields, returns “typically turn negative” after six months, said Jill Carey Hall, an equity and quant strategist with BofA, in a note Monday. Small-cap stocks underperform large-cap equities 70% of the time during the inversion, according to the note.
BOFA GLOBAL RESEARCH NOTE DATED APRIL 4, 2022
Two-year Treasury yields
TMUBMUSD02Y,
exceeded 10-year yields
TMUBMUSD10Y,
on Friday, a so-called inversion that continued into Monday afternoon trading, according to FactSet data, at last check. Many investors start to worry when that portion of the Treasury yield curve inverts because historically its inversion has preceded a recession, though history has shown a potential economic downturn could be more than a year away.
The yield curve is “typically a long-lead recession forecasting tool, but with some false signals,” such as the inversion seen in the mid-1960s when small-cap stocks outperformed, according to the BofA note. While some contend an inversion of two-year and 10-year yields may be less reliable today than in the past, partly due to ultra-low rates outside the U.S. suppressing the yield curve, “we recognize the risk in saying ‘this time is different,’ and believe medium-term risks have risen.”
BofA remains “near-term favorable” on small-cap stocks versus large-cap, wrote Hall, but “a more cautious stance could be warranted in future months if more indicators roll.”
Meanwhile, BofA recommends tilting toward “quality” when stock picking. Investors seeking small-cap exposure through passive bets in the stock market should favor “the higher-quality S&P 600” index over the Russell 2000 benchmark, according to the note.
The Russell 2000
RUT,
has dropped around 6.9% this year, exceeding the 5.5% decline for the S&P Small Cap 600
SML,
according to FactSet data, at last check. Both of those small-cap benchmarks have fared worse than the S&P 500 index
SPX,
a gauge of large-cap U.S. stock performance that’s down around 4.1% this year based on Monday afternoon trading.
“Small cap valuations have been reflecting a lot of worry,” said Hall. The price-to-earnings ratio of small-cap stocks relative to large-cap equities is “cheaper than ahead of any other curve inversion,” while absolute valuations are also less expensive, she wrote.

