
This post was originally published on this site
The sharp U-turn the stock market took following Russia’s invasion of Ukraine, which turned a sharp selloff into a broad rally, has produced multiple bullish reversal patterns that suggest the worst of the recent weakness may have passed for many stocks, and perhaps the broader market.
A “bullish engulfing,” which is one of the more well known and recognizable candlestick chart patterns, suggests momentum may have swung in favor of the bulls. When the pattern appears at the low of a recent trend, it suggests that trend may have just ended.
Many chart watchers believe that the deeper the decline when the pattern appears, and/or the longer the downtrend, the more likely the pattern produces a bottom. Read more about “bullish engulfings.”
As per candlestick charting textbooks, a “bullish engulfing” is a multi-day pattern, the first being a day when a stock or index closes below where it opens, and at a fresh low. On the second day, the stock/index gaps lower at the open, in which opening price is below the previous day’s close, then reverses course to close above the previous session’s open.
Don’t miss: 7 key candlestick reversal patterns.
The idea behind the pattern, which can also be referred to as a “key reversal” pattern, is that bulls have withstood the bears’ final thrust, and then launched a successful counterattack.
A gain the next day supports the notion that the trend has reversed.
Also read: S&P 500’s correction comes with first ‘bullish divergence’ chart signal.
Keep in mind that prices will often hold steady, and may even pull back, in the days following “bullish engulfings,” as both bulls and bears assess the new landscape. But the bullish message of the pattern remains intact until a new low is made.
The following charts show several examples of “bullish engulfing” patterns that appeared on Thursday.
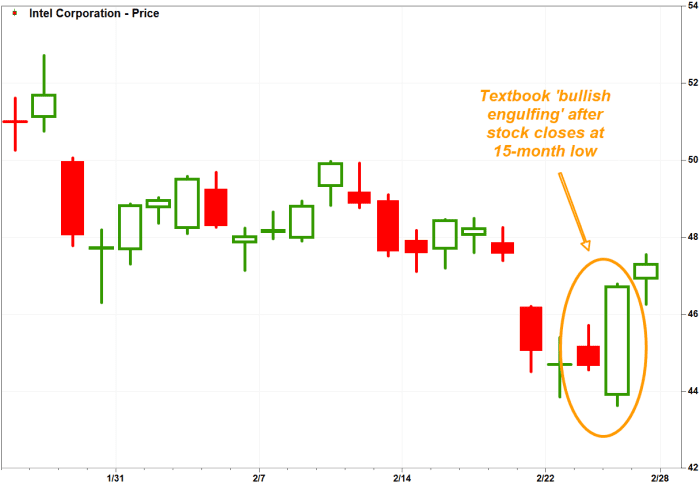
Intel
Shares of Intel Corp.
INTC,
opened Wednesday at a $45.17 then closed at a 15-month low of $44.65. On Thursday, the semiconductor maker’s stock gapped down to $43.90 at the open (down 1.7%), then swung higher to close up 4.8% at $46.72 to fully engulf the previous session’s trading range.
FactSet, MarketWatch
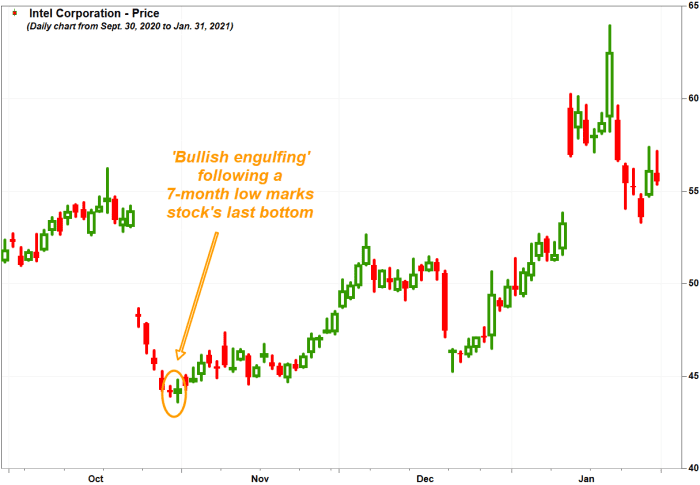
A bullish engulfing appeared the last time the stock bottomed. It closed at a seven-month low of $44.11 on Oct. 29, 2020, then after the reversal appeared the next day, the stock soared 55% before it peaked at a 15-month high of $68.26 on April 9, 2021.
FactSet, MarketWatch
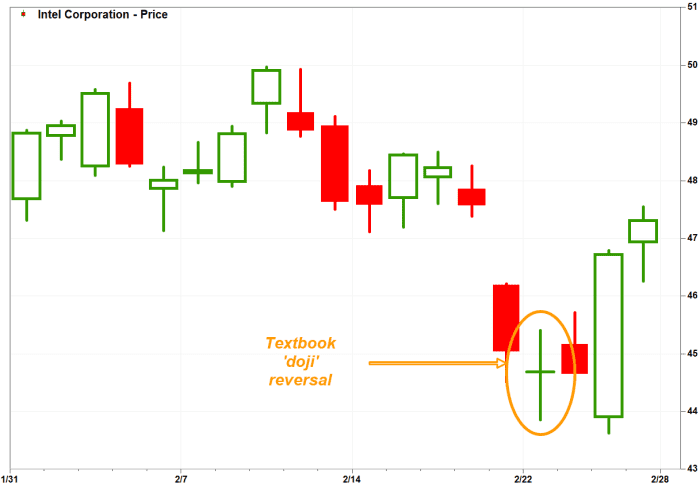
The good news for Intel bulls is that Thursday’s bullish engulfing came just two days after another key candlestick reversal pattern, known as a “doji.”
FactSet, MarketWatch
A “doji”, which in Japanese means at the same time, is when the stock opens and closes at the same, or very close to the same price. When the pattern appears at the lows of a recent downtrend, it suggests that trend may be about to change.
When “doji” price is in the middle of a day’s trading range, it suggests that after a big struggle, supply and demand have reached equilibrium, making it easier for bulls to take charge.
The stock opened Tuesday at a fresh low $44.69, then traded in an intraday range of $43.85 (down 2.6%) to $45.40 (up 0.8%) before closing at $44.69.
The stock rose 1.6% in afternoon trading on Friday.
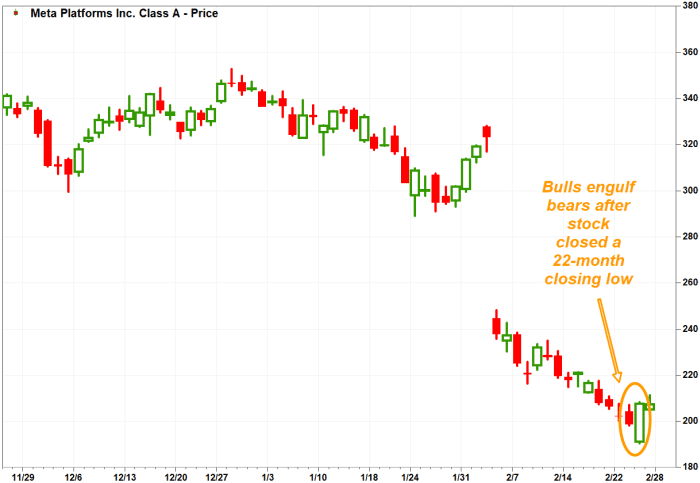
Facebook parent Meta
Social media giant Meta Platforms Inc. shares
FB,
closed Wednesday down 1.8% at $198.45, the lowest closing price since April 29, 2020. Then on Thursday, the stock opened down 3.7% at $191.06, hit an intraday low of $190.22, before bouncing sharply to close up 4.6% at $207.60.
FactSet, MarketWatch
That engulfing pattern followed a near doji on Tuesday, when the stock opened at $202.34 and closed at $202.08.
The stock rose 0.8% in afternoon trading on Friday.
Twitter Inc.’s stock
TWTR,
has been trending down for nearly a year, since it peaked at a record close of $77.63 on March 1, 2021.
On Wednesday, the social media company’s stock fell 0.5% to $32.76, the lowest closing price since July 6, 2020.
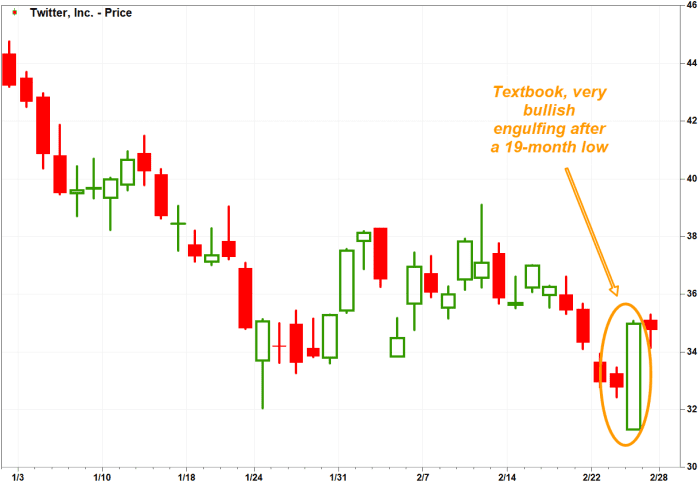
FactSet, MarketWatch
The next day, it gapped down 4.5% at the open before bulls took charge, and the stock closed up 6.8% at $34.98. Basically, bulls made their mark by completely engulfing the trading ranges of the previous two sessions.
In afternoon trading on Friday, the stock tacked on 0.8%.
Also read: Facebook-parent Meta’s stock bounces after chart flashed most oversold reading in a decade.
Microsoft
Microsoft Corp.’s stock
MSFT,
dropped 2.6% on Wednesday to close at a seven-month low of $280.07.
On Thursday, the software giant’s stock opened down 2.8% at $272.51, hit an intraday low of $271.52, then bounced 8.5% off that low to close up 5.1% on the day at $294.59.
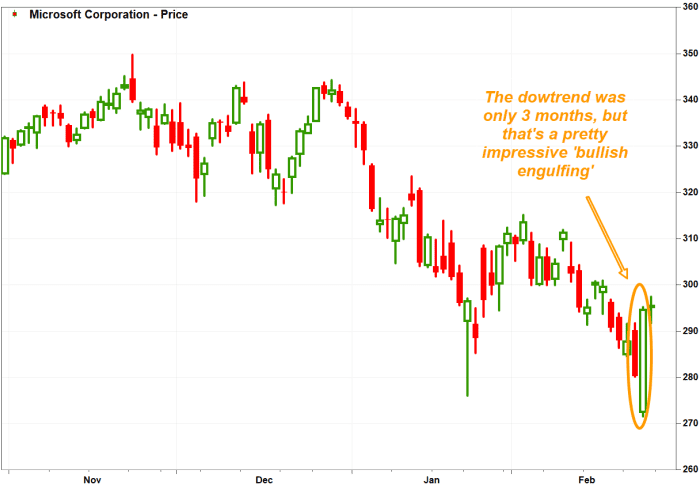
FactSet, MarketWatch
The difference between Microsoft’s bullish engulfing, and that of Twitters and Meta, is that the downtrend has lasted only three months, since the stock closed at a record $343.11 on Nov. 19.
On Friday, the stock edged up 0.5% in afternoon trading.
Salesforce
Shares of Saleforce.com Inc.
CRM,
sank 2.4% on Wednesday to close at a 19-month low of $190.54, or 38.5% below its Nov. 8, 2021 record close of $309.96.
Then on Thursday, it opened down 3.0% at $184.74, but bounced sharply to close up 7.2% at $204.29.
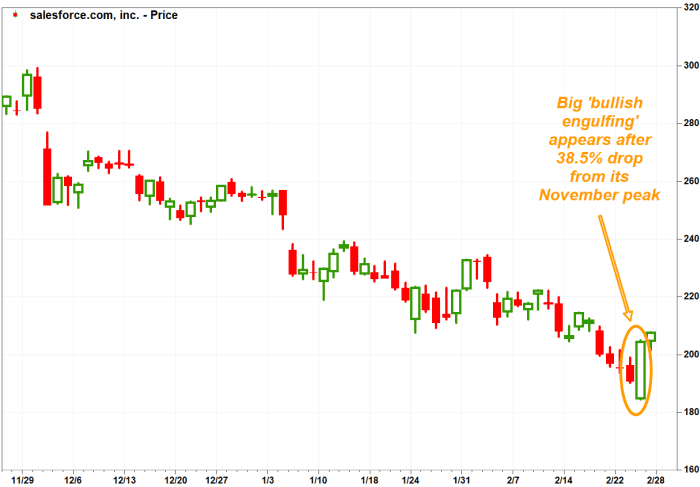
FactSet, MarketWatch
The customer relationship management software company’s stock rose another 1.7% on Friday, but remained the worst performer of the Dow Jones Industrial Average’s
DJIA,
30 components over the past three months.
Retailer ETF
The list of charts in which “bullish engulfings” appeared wasn’t limited to large-capitalization technology stocks. The SPDR S&P Retail exchange-traded fund
XRT,
closed Wednesday down 2.4% at $73.06, the lowest price since Jan. 20, 2021, and 29.9% below the Nov. 16, 2021 record close of $104.16.
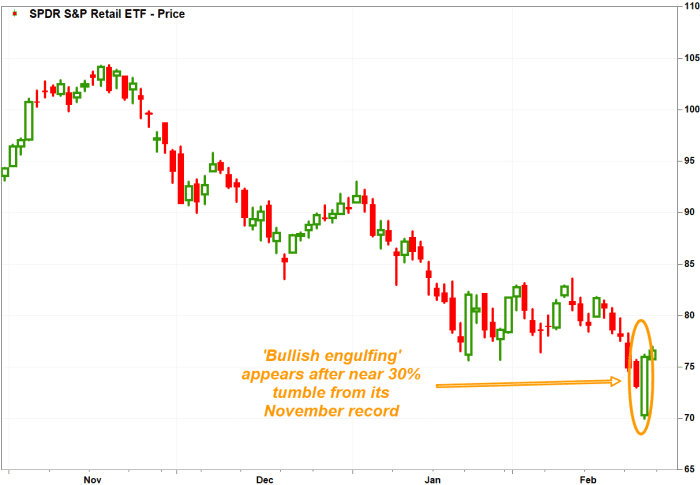
FactSet, MarketWatch
On Thursday, the ETF opened with a 4.2% dive to $69.98, but bounced to a 3.9% gain at its close of $75.93.
The ETF extended that bounce with a 1.4% gain in afternoon trading on Friday.
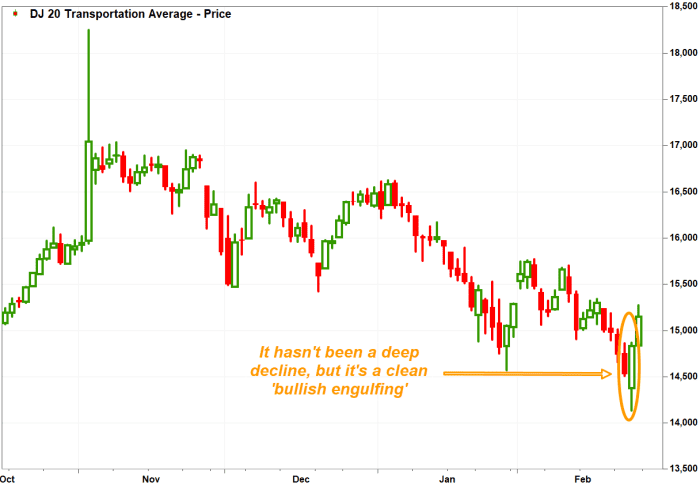
Dow transports
While “bullish engulfings” didn’t appear in the Big 3 stock market indexes, one appeared in the Dow Jones Transportation Average’s
DJT,
chart. That index is viewed as a proxy for economic growth, as it tracks the companies that take and deliver what other companies make.
The index fell 1.4% on Wednesday to a 4 1/2-month low of 14,523.47, which was 14.8% below its record close of 17,039.38 on Nov. 2, 2021.
On Thursday, it opened down 1.0% at 14,375.20, then fell as much as 2.7% to its intraday low of 14,311.59, before roaring back to close up 2.1% at 14,826.94.
FactSet, MarketWatch
Many chart watchers follow the performance of the Dow transports, as a key tenet of the Dow Theory of market analysis, which has remained relevant on Wall Street for more than a century, is that important bull or bear market signals can’t appear unless both the Dow transports and Dow industrials are trending in the same direction.
On Friday, the Dow transports ran up 373 points, or 2.5%, in afternoon trading, while the Dow industrials hiked up 783 points, or 2.4%.


