
This post was originally published on this site
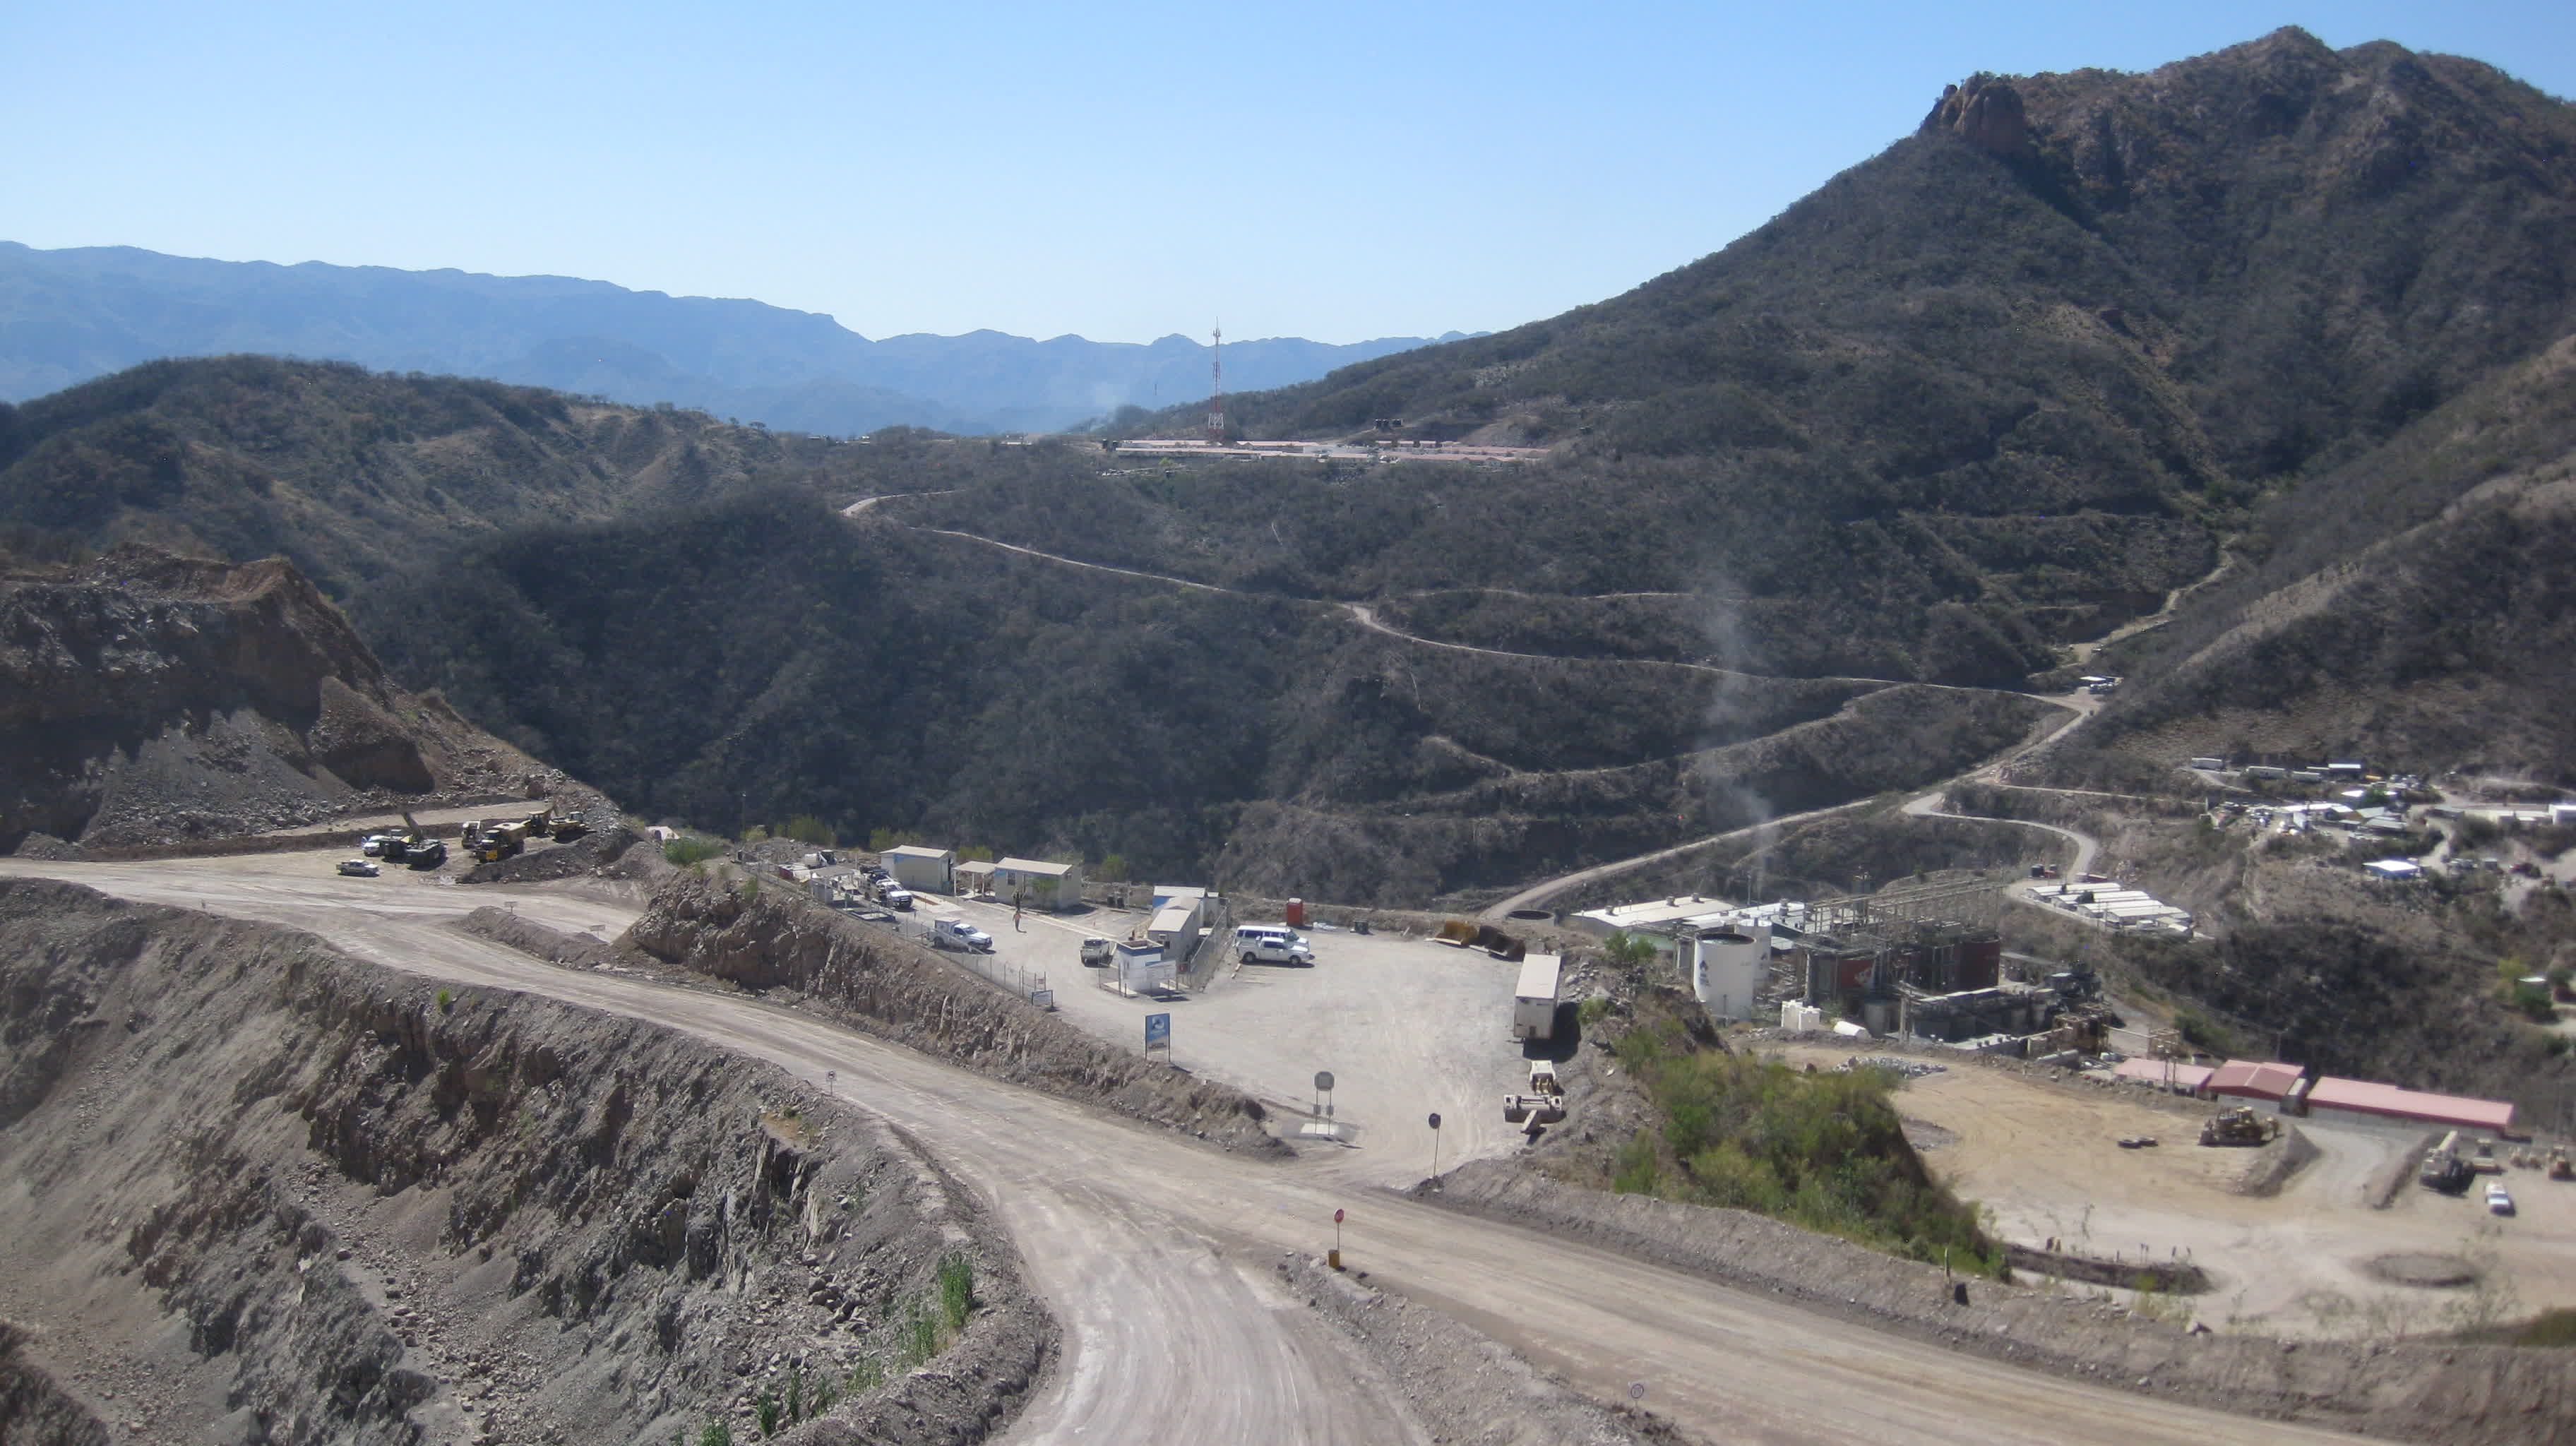
Image: Coeur Mining – Palmarejo operation located in Chihuahua Province, Mexico
Investment Thesis
The Toronto-based Franco-Nevada (NYSE:FNV) released its first-quarter 2020 results on May 7, 2020. I was not impressed by the results, and if it were not for the high price of gold, they would have been tagged as lackluster. However, the gold market has entered a bullish phase, and nothing could push away investors from buying miners and streamers right now.
The gold equivalent produced was far from the record achieved the precedent quarter, as we see later in this article. Furthermore, the company indicated after-tax impairment charges of $207.4 million ($271.7 million pre-tax) related to its energy interests in the Permian and Marcellus Basins.
Below are the revenues per segment in the first quarter of 2020:
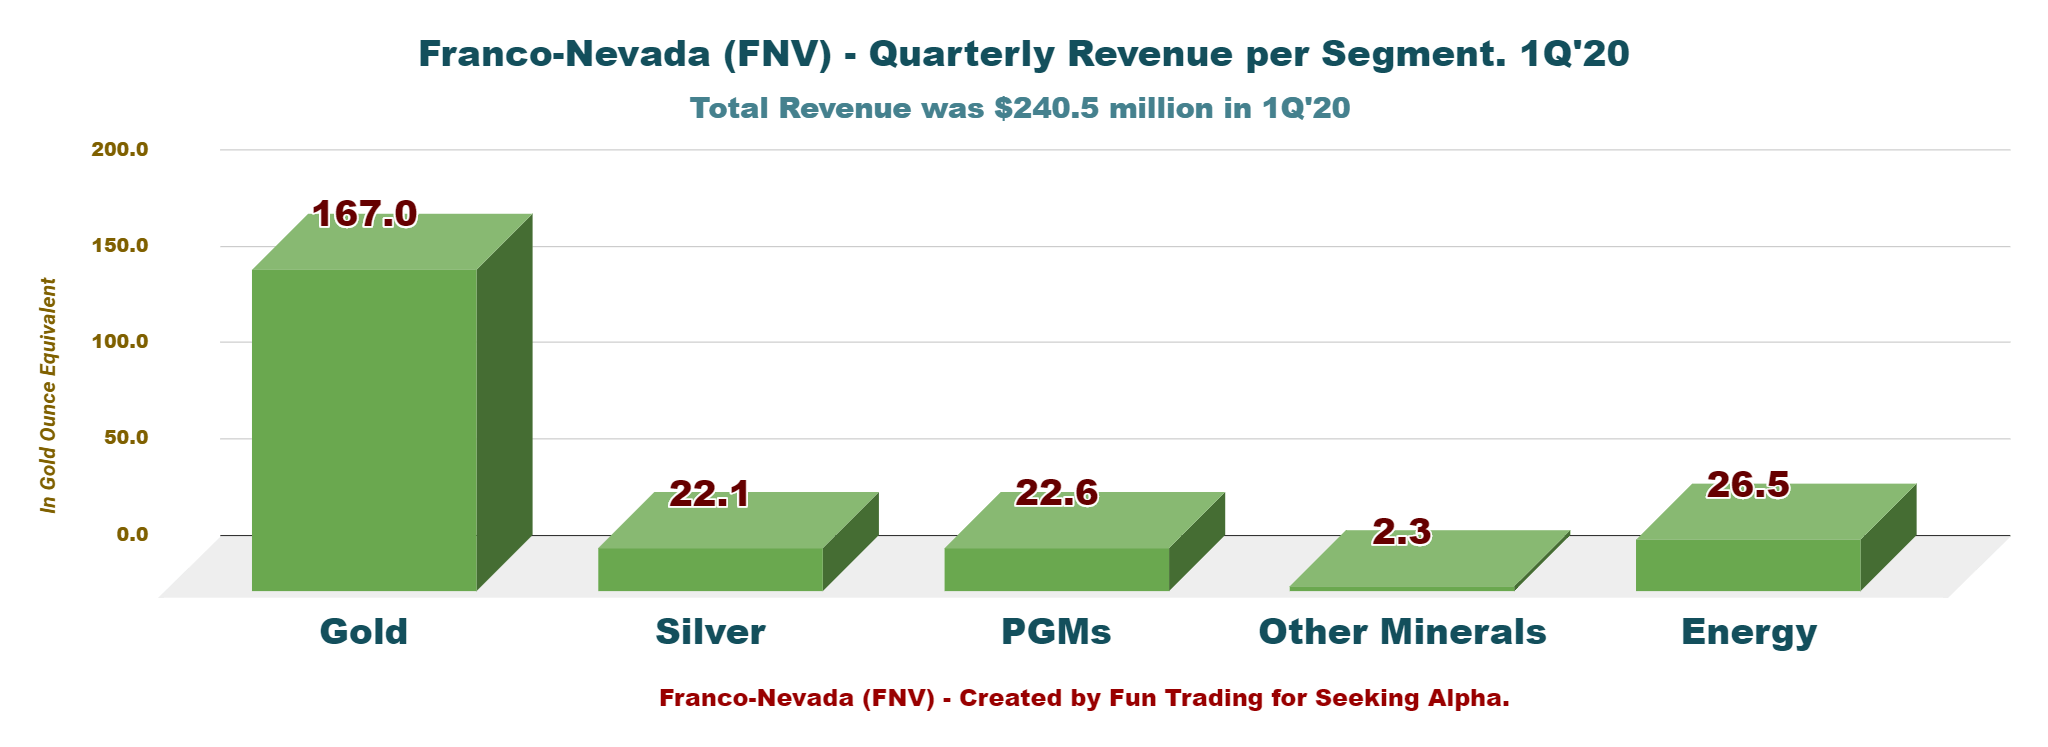 Looking at the revenues per metals and energy, we see that Franco-Nevada is still highly dependent on the price of gold, which represents 69.4% of the total revenues of 1Q’20 and 63.4% the same quarter in 2019.
The Oil & Gas segment represented 11% in 1Q’20 and (11.6% in 1Q 2019) is weakening a little bit and further downsides are expected (oil & gas revenues come from the US Permian Basin and the company’s new expansion in the Marcellus basin since July last year).
The investment thesis continues to be the same since I covered the company on Seeking Alpha. It is one of my long-term investments, and of course, I recommend a long-term investment. The company’s fundamentals are strong, and the potential for growth is evident. However, it is also essential to use part of your position to trade the short-term volatility, and with gold, we have plenty of that.
Furthermore, Franco-Nevada is now debt-free and pays a small dividend yield of 0.84%, which is supported by ample free cash flow.
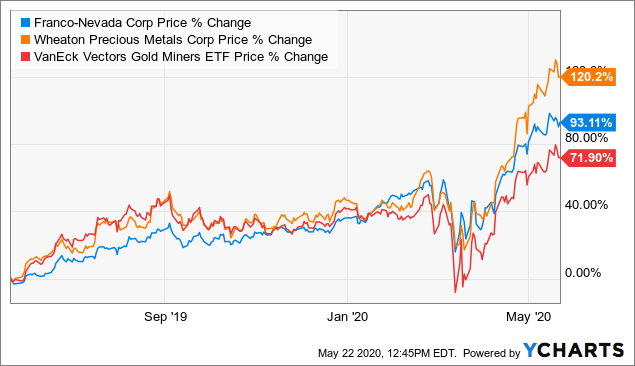
How the company fared compared to its nearest rival, Wheaton Precious Metals (NYSE:WPM)?
The stock has outperformed the VanEck Vectors Gold Miners ETF (GDX) and can be considered an excellent proxy for gold. FNV has done slightly better than its competitor Wheaton Precious Metals. I recommend reading my recent article on WPM by clicking here.
 Data by YCharts
Sandip Rana, the CFO, said in the conference call:
The main source of the increase was from Cobre Panama. This asset began delivering gold and silver ounces to Franco-Nevada in third quarter of 2019. The company sold approximately 25,000 GEOs from the mine during the quarter.
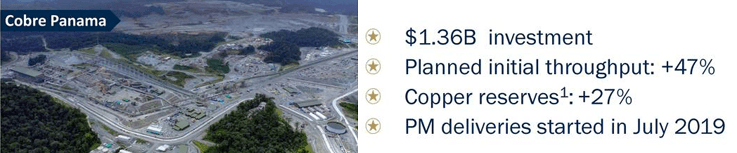
From Presentation
However, we should expect some production disruptions due to COVID-19 next quarter. In the press release:
Operations at Cobre Panama and Antamina have been temporarily suspended. Antapaccay and Candelaria continue to operate at normal levels. Eleven of the 52 cash-flowing assets have announced temporarily reduced or curtailed production, 5 of which have since resumed activities,
Thus, I recommend trading actively short term about 40% of your position by taking advantage of the sector volatility using technical analysis and RSI. This dual strategy (short-term and long-term) is crucial and provides not only a substantial increase in profit, but also reduces the risk attached to such recent market correction.
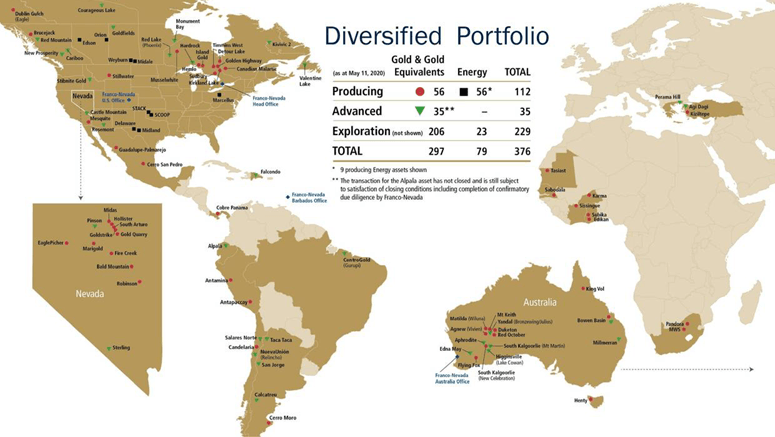
Franco-Nevada’s Highly Diversified Portfolio – A Definitive Advantage
Franco-Nevada owns a majority of assets in North America and Australia, which are regions considered as “safe jurisdiction” for mining. FNV now has 56 producing mines.
 Source: FNV Presentation
A Solid Balance Sheet And Production In 1Q 2020
| Franco-Nevada | 4Q’18 | 1Q’19 | 2Q’19 | 3Q’19 | 4Q’19 | 1Q’20 |
| Total Revenues in $ Million | 148.2 | 179.8 | 170.5 | 235.7 | 258.1 | 240.5 |
| Net income in $ Million | -31.3 | 65.2 | 64.0 | 101.6 | 113.3 | -98.8 |
| EBITDA $ Million | 44.1 | 141.0 | 138.3 | 193.7 | 202.1 | -78.2 |
| Adjusted EBITDA $ Million | 118.7 | 140.9 | 137.9 | 192.9 | 201.7 | |
| EPS diluted in $/share | -0.17 | 0.35 | 0.34 | 0.54 | 0.60 | -0.52 |
| Operating Cash Flow in $ Million | 97.8 | 143.6 | 119.1 | 170.4 | 184.6 | 195.2 |
| CapEx in $ Million | 286.2 | 57.6 | 38.5 | 341.1 | 8.0 | 34.5 |
| Free Cash Flow in $ Million | -188.4 | 86.0 | 80.6 | -170.7 | 176.6 | 160.7 |
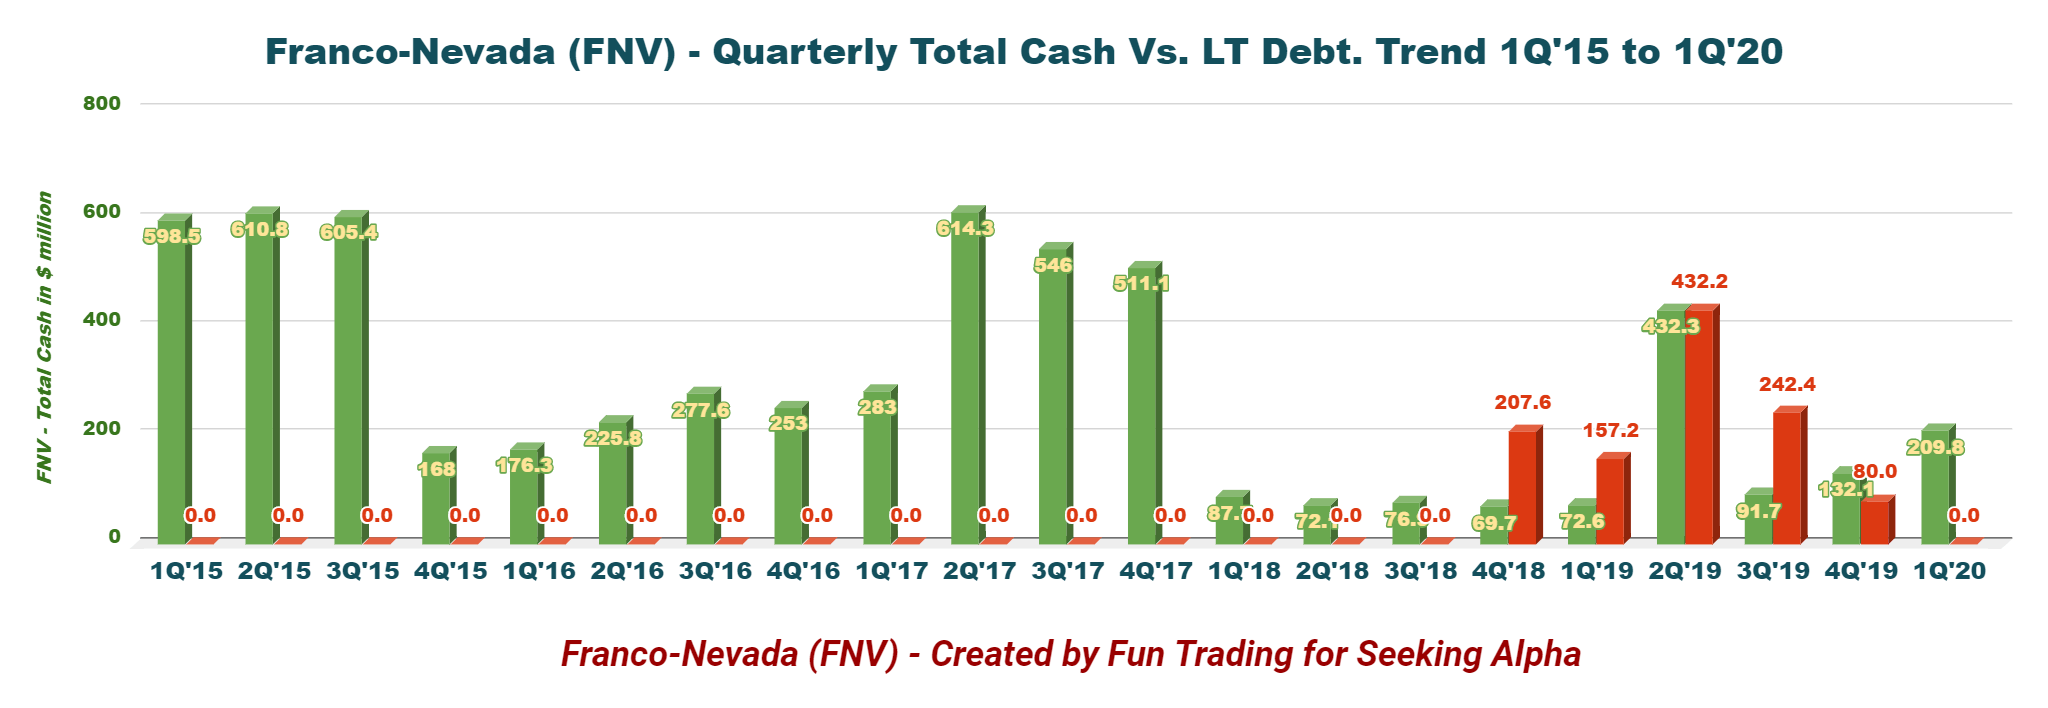
| Total cash $ Million | 69.7 | 72.6 | 432.3 | 91.7 | 132.1 | 209.8 |
| Long term Debt in $ Million | 207.6 | 157.2 | 432.2 | 242.4 | 80.0 | 0 |
| Dividend per share in $ | 0.24 | 0.25 | 0.25 | 0.25 | 0.25 | 0.26 |
| Shares outstanding (diluted) in Million | 186.1 | 187.3 | 187.5 | 188.1 | 189.2 | 189.8 |
| GEO’s | 4Q’18 | 1Q’19 | 2Q’19 | 3Q’19 | 4Q’19 | 1Q’20 |
| Production gold equivalent K Oz Eq. | 104.877 | 122.049 | 107.774 | 133.219 | 153.396 | 134.941 |
| Gold price | 1,228 | 1,304 | 1,310 | 1,472 | 1,480 | 1,583 |
Data Source: Company document and Morningstar
Note: More historical data starting 2015 are available for subscribers only.
Trends And Charts: Revenues, Earnings Details, Free Cash Flow, Debt, And Production Details
1 – Revenues were $240.5 million in 1Q’20
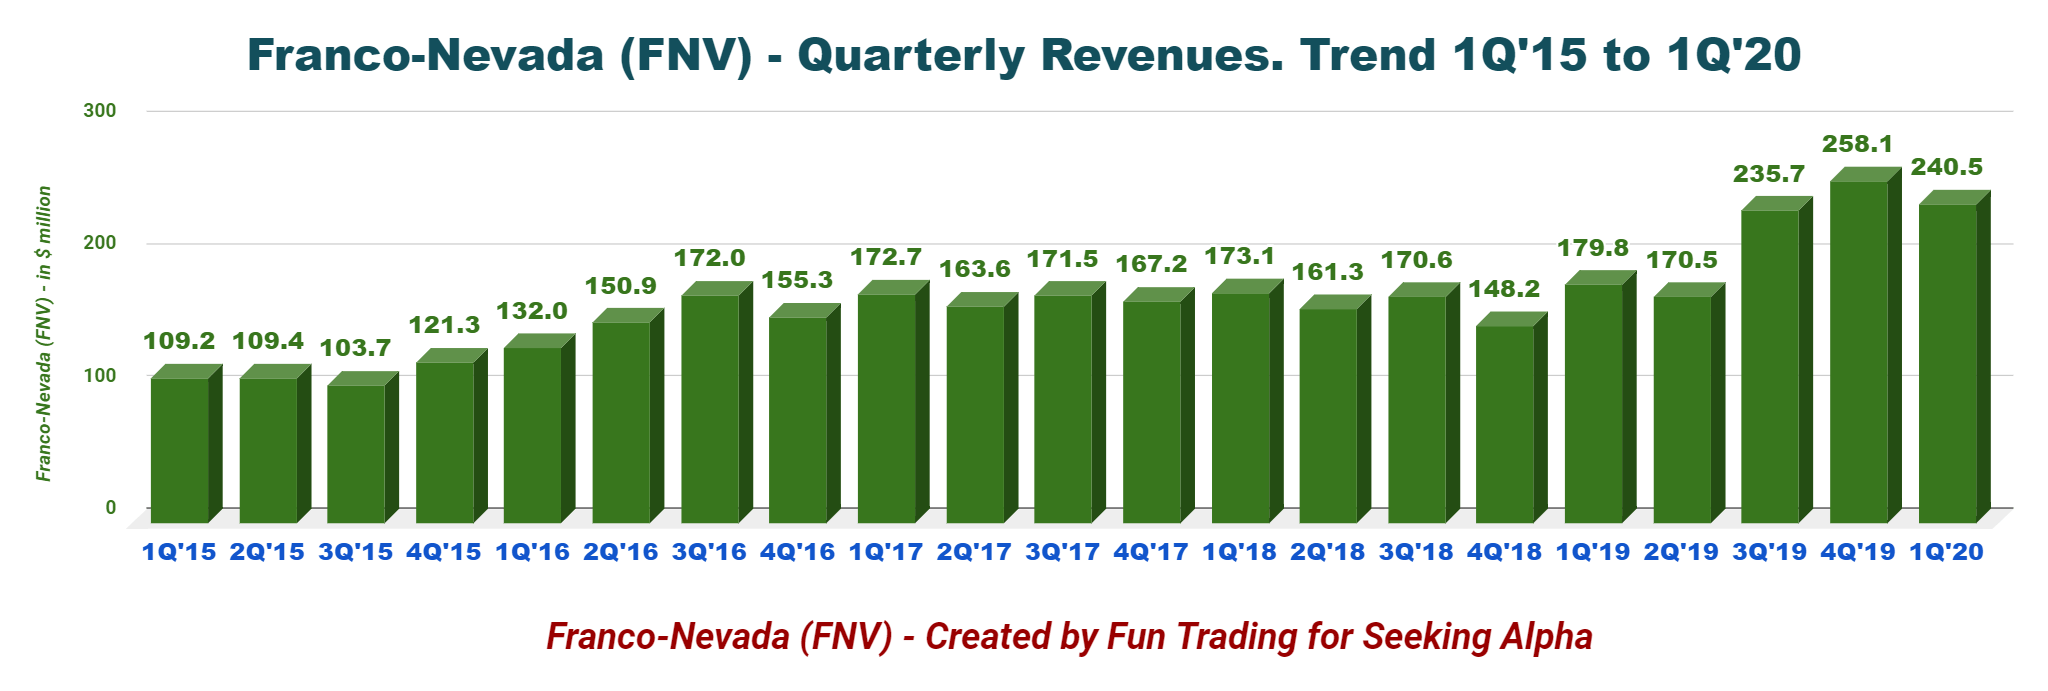 During the first quarter of 2020, the company generated revenues of $240.5 million, up 33.8% for the same quarter a year ago and down 6.8% sequentially. Revenues beat analysts’ expectations.
Net loss came in at $98.8 million or $0.52 per share and $109.2 million of adjusted net income, or $0.58 per share. Also, operating cash flow was $195.2 million in the first quarter, up from $143.6 million sequentially.
Oil and gas assets once again added to Franco-Nevada’s overall results. Revenues from the company’s energy assets for 1Q’20 came in at $26.5 million compared to $20.8 million in 1Q’19.
However, with the recent falling oil and gas prices, I expect the second quarter to be very weak.
2 – Free cash flow was $160.7 million in 1Q’20
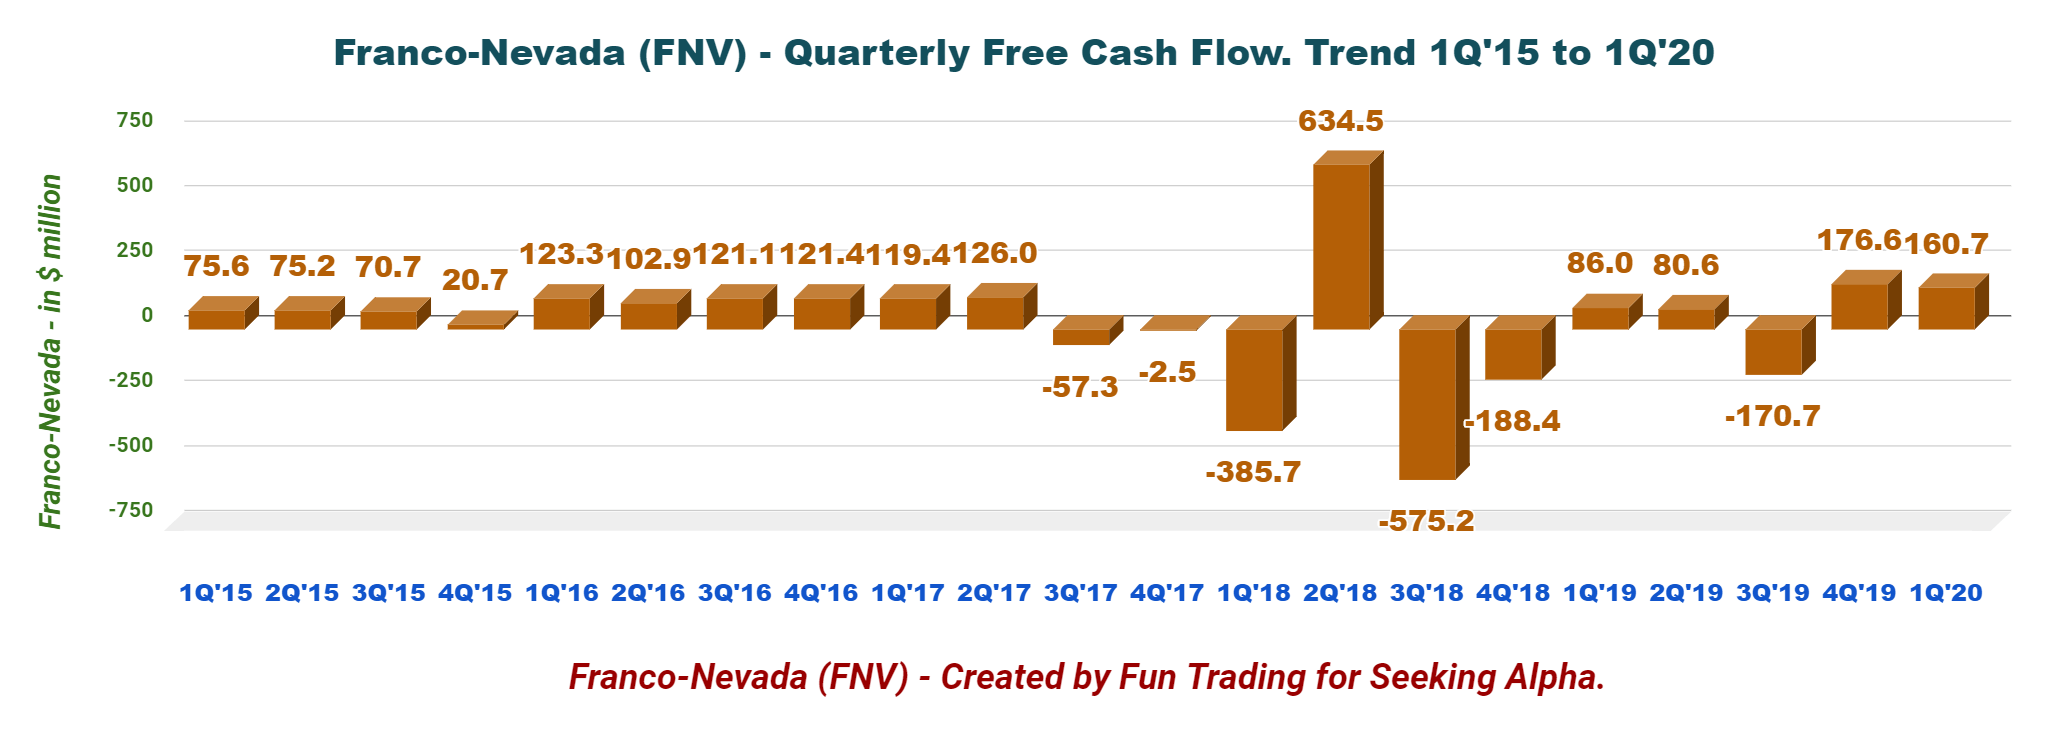 Note: The Free cash flow is cash from operating activities minus CapEx.
Historically, free cash flow has been affected significantly in the third and fourth quarters of 2018 due to a significant CapEx.
However, the company posted a profit in free cash flow this quarter of $160.7 million with yearly free cash flow (“ttm”) of $247.2 million, even after several significant acquisitions (e.g., Cobre Panama, Permian, and Marcellus).
The company’s board announced a quarterly dividend of $0.26 per share, which is a 4% increase from the prior dividend of $0.25 per share. It is the 13th consecutive annual dividend increase for the company’s shareholders. The dividend yield is now 0.71%, which is very low, and the company could do better.
3 – The company has strong liquidity of $1.5 billion in 1Q’20 and is now debt-free
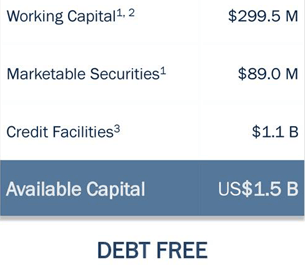
Source: Q1 Presentation
The financial situation is excellent now.
4 – Production in Gold equivalent ounce was 134,941 GEOs in 1Q’20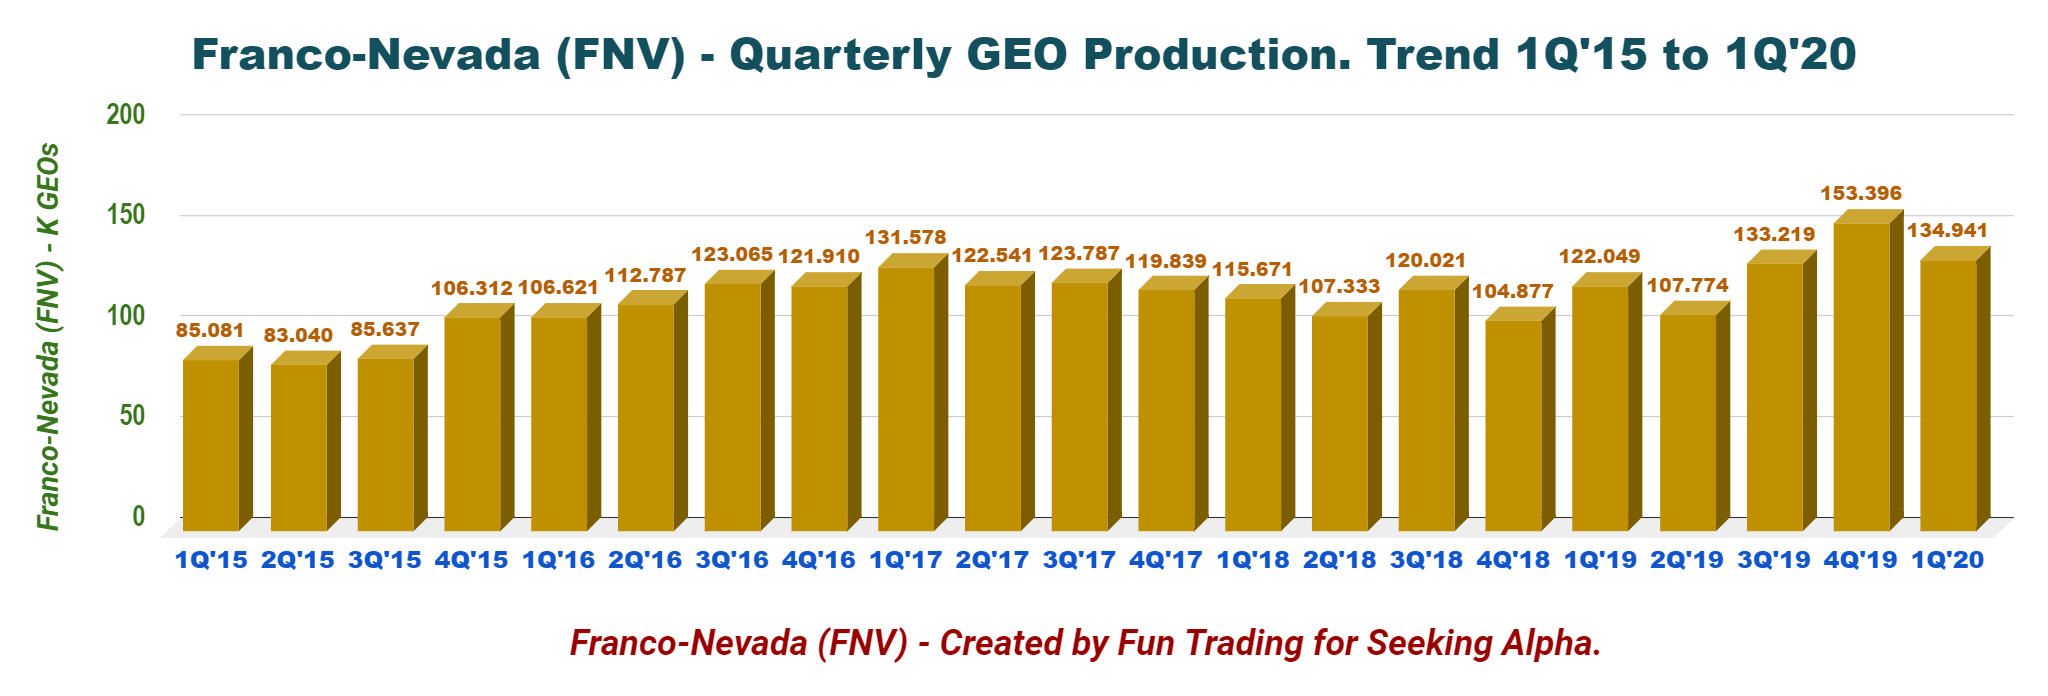 Franco-Nevada stated that it sold 134,941 gold equivalent ounces in Q1’20, up from 122,049 GEOs in the same quarter a year ago, an improvement of 10.6%. Higher contributions from Cobre Panama, Guadalupe-Palmarejo, and Hemlo helped to offset lower contributions from Candelaria, Antapaccay, and Sabodala mines.
Gold represented 78.4% of the total output in 1Q’20, excluding energy. Details are presented below:
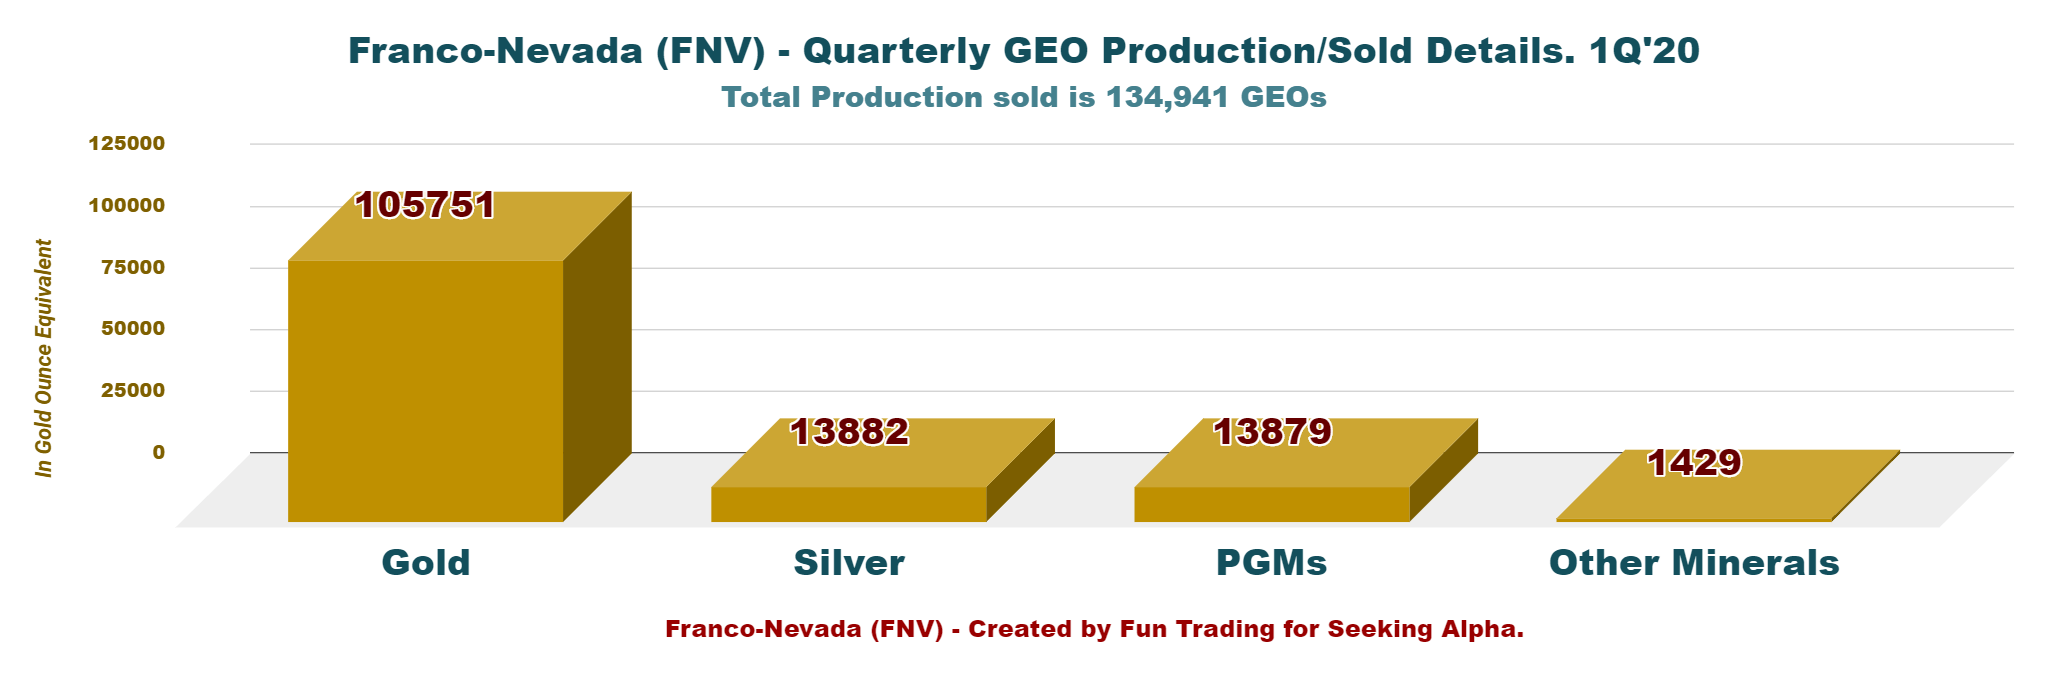
In the first quarter of 2020, the average gold price was $1,583/oz, 21.4% higher from the same quarter a year ago. Silver prices averaged $16.90/oz, up 8.5% year over year. Finally, Platinum prices went up 9.7% year over year to $903/oz, and palladium prices jumped 59.2% year over year to a whopping $2,284/oz.
6 – Guidance 2020
The guidance has been withdrawn pending stabilization of mining and energy markets. However, the company indicated a 2024 outlook.
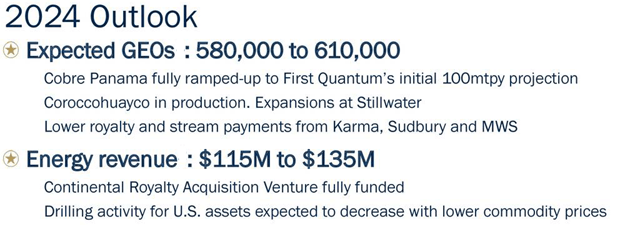
Source: Q1’20 Presentation
Conclusion And Technical Analysis
While the market celebrated the first-quarter revenues, Franco-Nevada’s mining production next quarter will undoubtedly be affected by the curtailments due to the COVID-19 pandemic, which I have indicated earlier in my article. Furthermore, the energy segment is expected to be less than 10% of the company’s current-year revenues due to the sharp drop in commodity prices and drilling activity.
However, the price of gold has increased significantly to close today at $1,735 per ounce, which is nearly 10% higher than what FNV received in the first quarter.
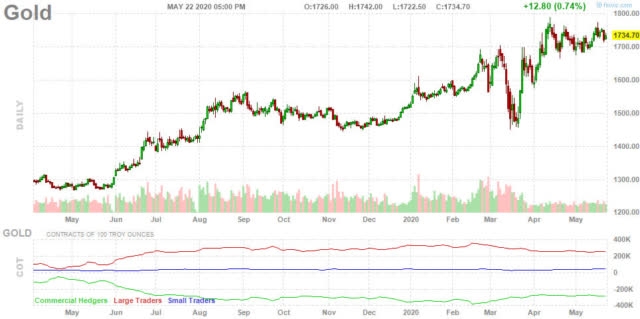
This increase in the gold and silver prices will more than offset any losses in production in 2Q’20, in my opinion.
My only problem with FNV is that it is trading quite high and is approaching an overbought situation. While the gold price is now somewhat plateauing short term around $1,720 per ounce, any stock uptick would indicate divergence and a strong signal to take some profit off the table.
Technical Analysis
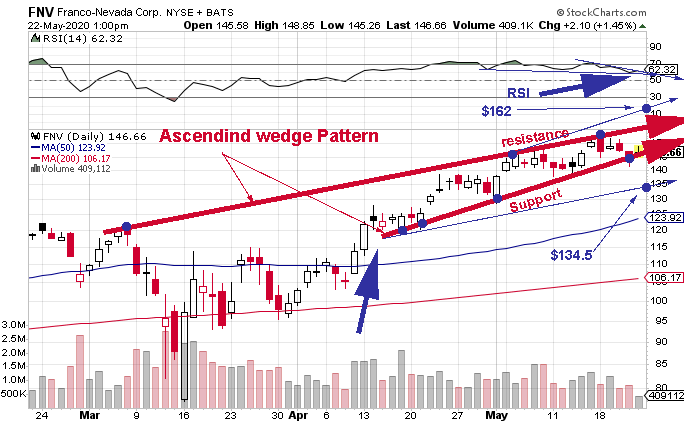 FNV is forming an ascending wedge pattern with line resistance at $153 and line support around $146. Generally, the ascending wedge is slightly bullish, but in FNV’s case, it may turn somewhat bearish.
What makes me think the stock may correct soon is that the RSI trend is showing a divergence, which means the RSI trend is down while the stock trend is up. In this case, we may experience a support breakout with lower support of around $134.5, where it could be possible to start buying again carefully.
I think the gold miners and streamers sector is now overbought and needs a sharp retracement. Hence, I recommend selling on any uptick now.
Conversely, if gold continues its tepid ascent, FNV could eventually trade higher with a new top around $162. I do not see that as likely, but it is still a possible event depending on the gold momentum.
Author’s note: If you find value in this article and would like to encourage such continued efforts, please click the “Like” button below as a vote of support. Thanks!

Join my “Gold and Oil Corner” today, and discuss ideas and strategies freely in my private chat room. Click here to subscribe now.
You will have access to 57+ stocks at your fingertips with my exclusive Fun Trading’s stock tracker. Do not be alone and enjoy an honest exchange with a veteran trader with more than thirty years of experience.
“It’s not only moving that creates new starting points. Sometimes all it takes is a subtle shift in perspective,” Kristin Armstrong.
Fun Trading has been writing since 2014, and you will have total access to his 1,865 articles and counting.
Disclosure: I am/we are long FNV. I wrote this article myself, and it expresses my own opinions. I am not receiving compensation for it (other than from Seeking Alpha). I have no business relationship with any company whose stock is mentioned in this article.
Additional disclosure: I also trade short term the stock frequently.


