
This post was originally published on this site
Please see the end of the article for an explanation of its purpose.
Let’s start with the performance table for the core ETFs: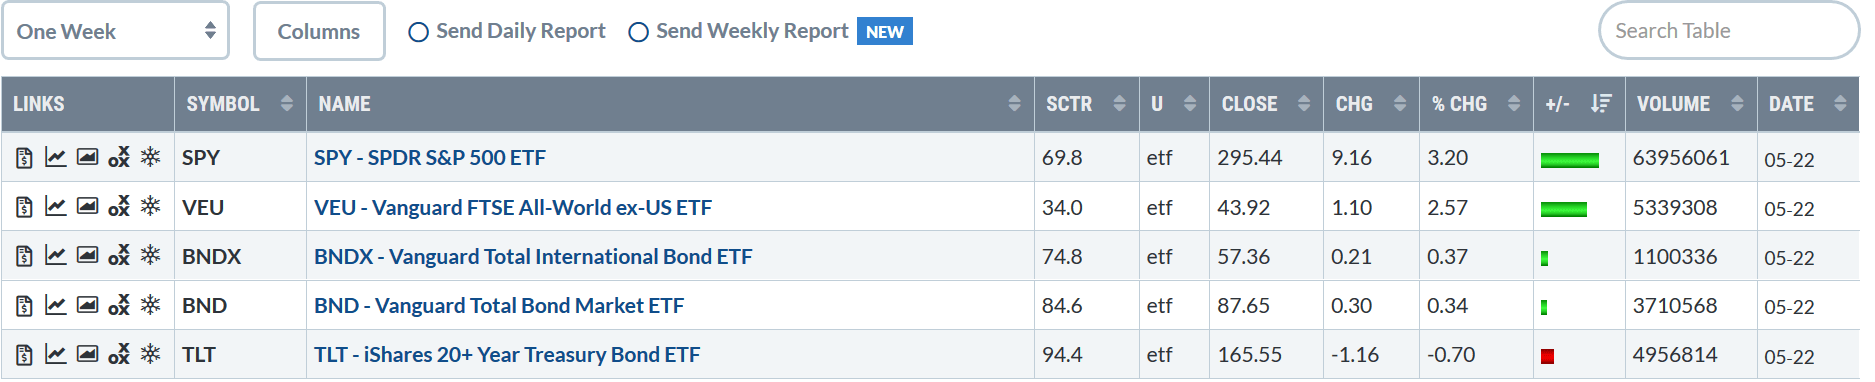 The SPY was the top performer, gaining 3.2%. But global markets also advanced, gaining 2.57%. The broad bond market ETFs were modestly higher while the TLT was off a bit more than fractionally.
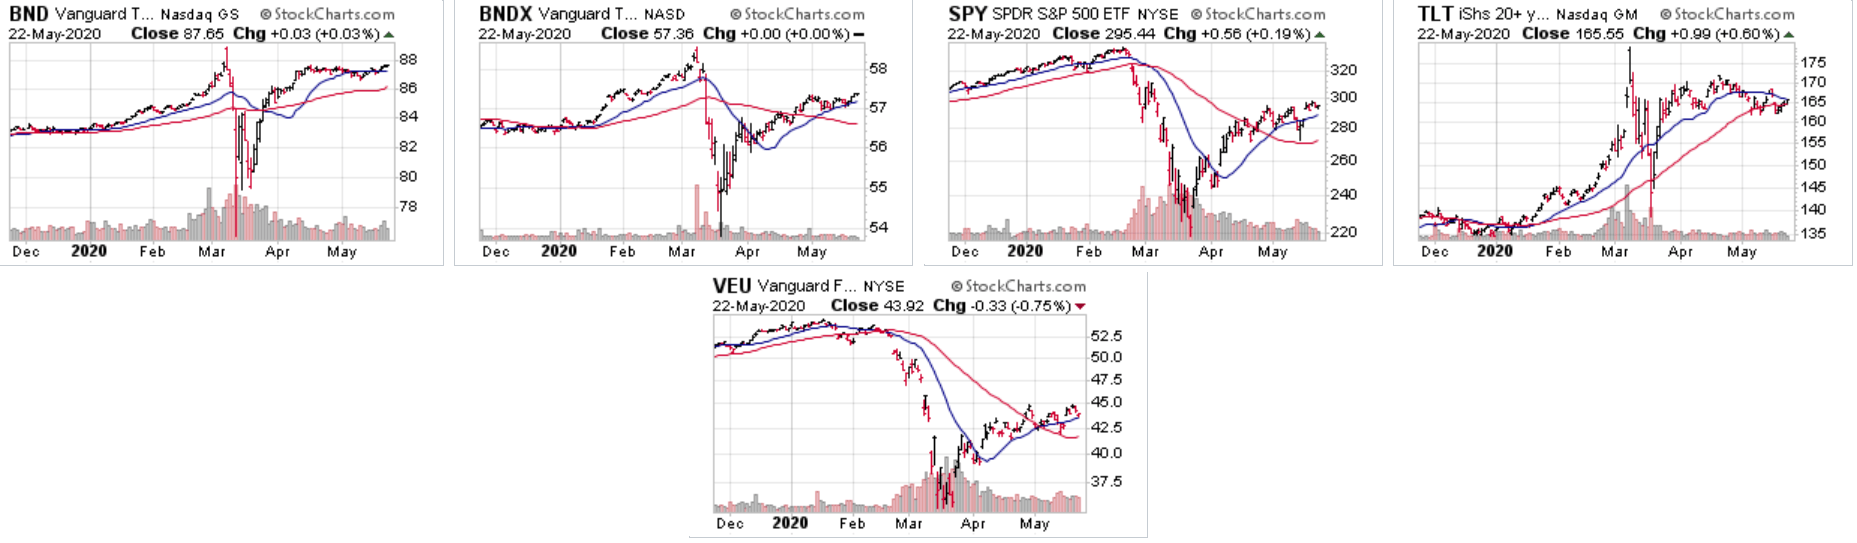 The 6-month charts show that the US bond market (upper left) has rebounded more or less to its high from March. Global bond markets (second from left) and equity markets (top row, second from right, and bottom) have regained about half their losses from the sell-off earlier in the year. The long-end of the US treasury market (top right) sold off for the briefest of times but is still trading near a 6-month high as traders keep looking for a pure safety play.
Next, let’s look at the core portfolios: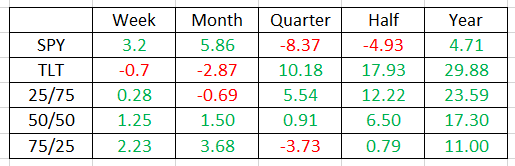 Data from Finviz.com; author’s calculations. The first number in the left column is the SPY/VEU percentage, while the second number is the TLT/BNDX percentage. If you’re more conservative, opt for the higher TLT/BNDX percentage portfolio. If you’re aggressive, reverse the process.
Considering the extreme market volatility during the last 3 months, the core portfolio has held up very well. The 50/50 allocation is up modestly in the week, month, and quarter time frames. Thanks to the TLT’s outperformance, the portfolio is still up in the 6-month and year time frames. 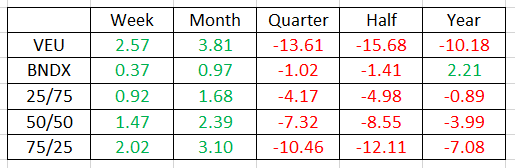 While the international portfolio is still down in the longer time frames, its performance in the week and month times comparable to the US’.
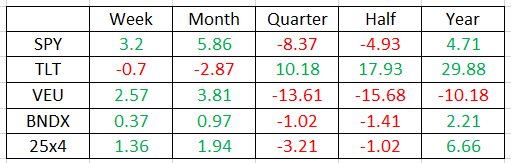 The broad portfolio is holding up very. It’s up modestly in the shorter-time frames and is only off modestly in the quarter and half-year time frames.
Here’s a chart comparing the data: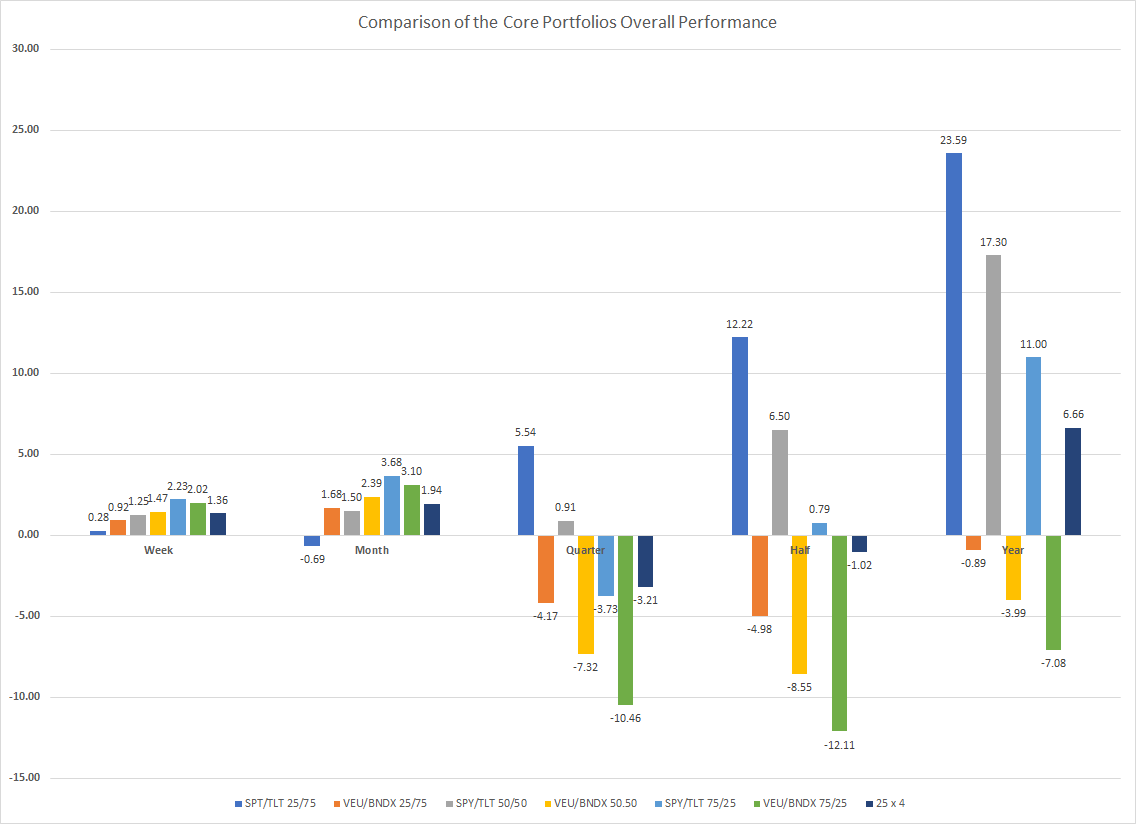
The first pair of columns (blue and orange) shows the 25/75 portfolio; the second pair (grey and yellow) shows the 50/50; the third pair (light blue and green) shows the 75/25. The last column of each series (the dark blue) is the 25×4 portfolio. The first column of each pair shows the SPY/TLT combination’s performance; the second pair shows the VEU/BNDX combination’s performance.
The chart shows the very clear short-term, longer-term performance split. During the last week and month, all the portfolios have performed on more or less equal footing whereas the US portfolio has outperformed over the last week.
Finally, here’s the core bond portfolio: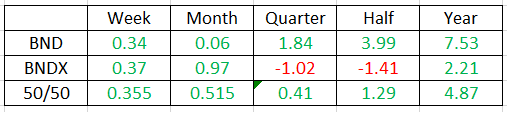
All I’ve really done here is the buy, well, everything. The idea is to create a “super money-market” fund that gives investors a higher yield. As of Friday’s close, this portfolio had a 2.94% yield. Its performance has been stable over the week, month, and quarter time-frames and is up modestly in longer time frames.
Next, let’s take a look at the sector ETF performance for the week: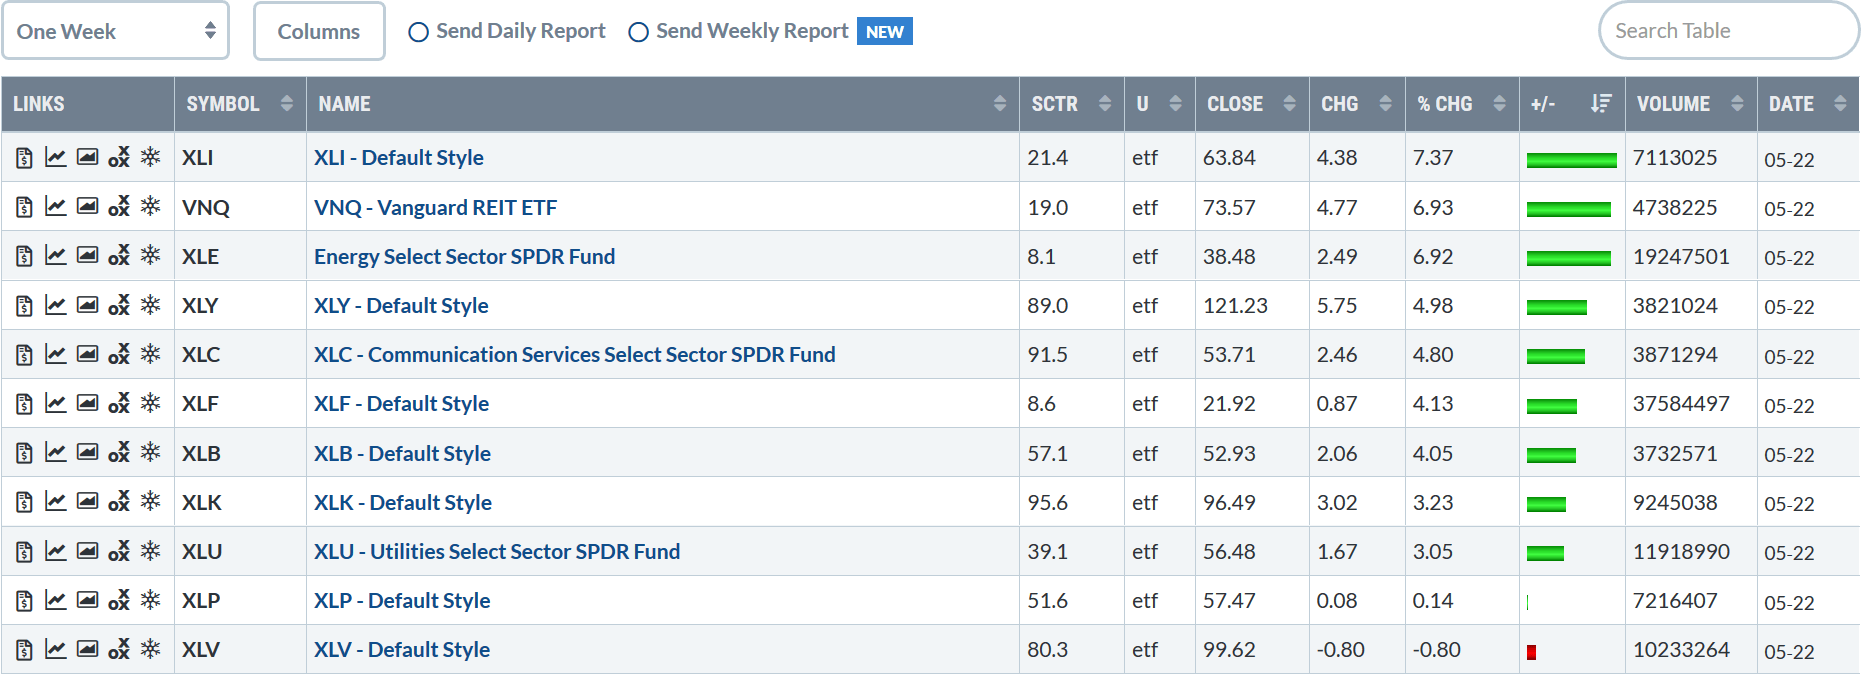 This was a solid week for the sectors with 10 of 11 gaining. There are three key pieces of information in the above chart. First, aggressive sectors led the market higher: industrials, energy, and consumer discretionary occupy three of the top four slots. Second, defensive sectors occupy the bottom three positions: utilities, consumer staples, and health care are the bottom three. Third, tech and communication services — which have led the market higher from the March bottom — are still rising but are in the middle of the pack.
Next, let’s look at the top and bottom three performing sectors for the last week, month, quarter, half-year, and year: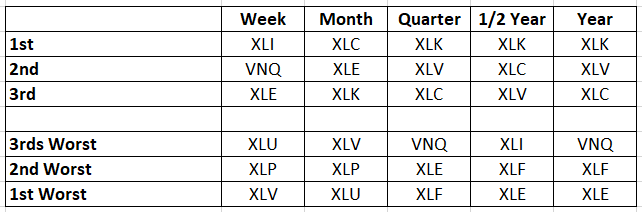 Data from Finviz.com
Here are the conclusions from above:
- Tech and communication services each appear four times in the best section.
- Energy has moved from being one of the worst performers (it appears three times in the worst section) to one of the best (it is one of the top three performers in the last month and week).
- Defensive sectors comprise the three worse performers over the last week and month.
Three sectors ETFs were on the buy/attractive list: (XLK) (XLC), (XLE). All three are still attractive. The first two are the only sectors that are clear beneficiaries of the lockdown while energy is rebounding with the broader oil market. Despite their appearance on the top three list this week, real estate and industrials aren’t attractive. The entire real estate sector is a hot mess right now. Most of the top ten holdings of the (XLI) are technically weak: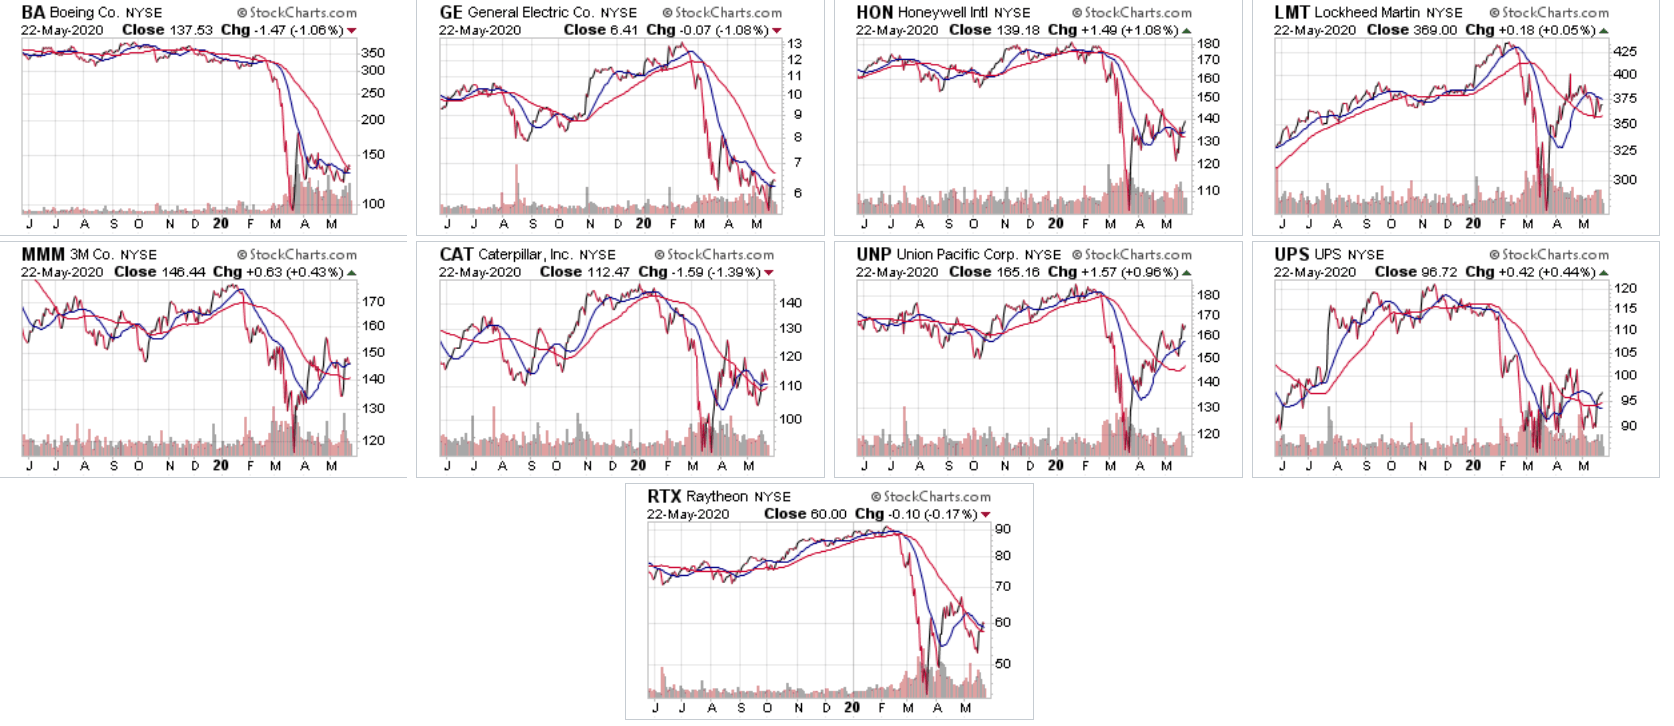 None of the above charts are strong; the best one is (UNP). The rest are in either the lower half of their 1-year range or are in sectors that will perform very poorly in the next few quarters.
Next, let’s look at the broad bond market ETFs: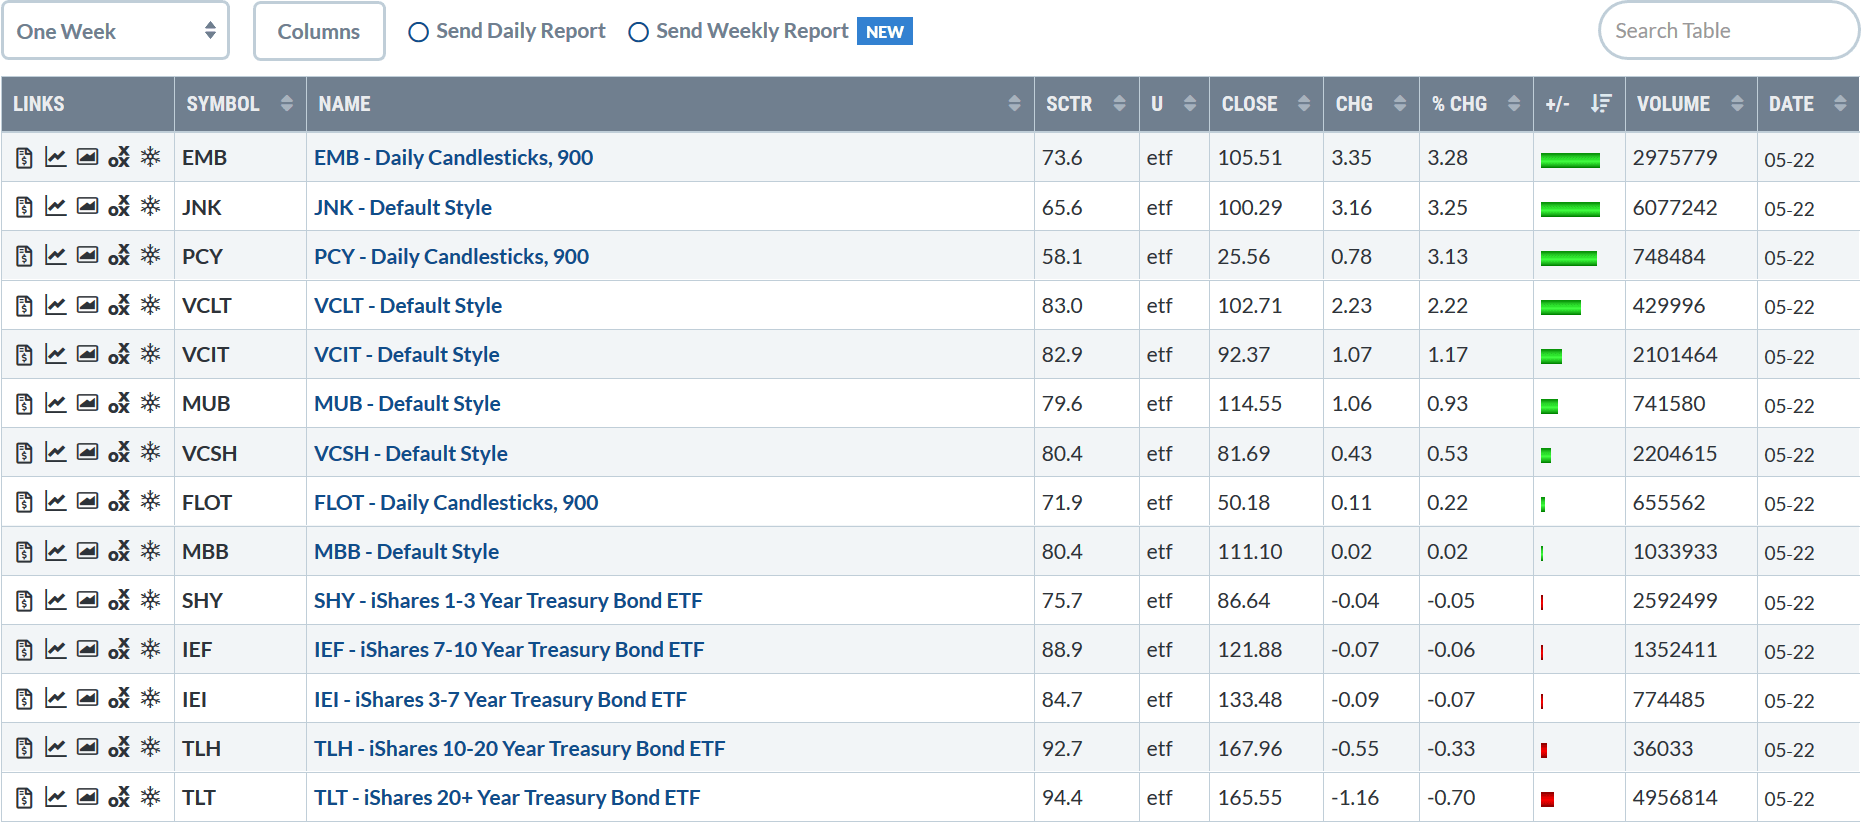 Last week, the riskier portions of the bond market topped the list. Emerging market debt, junk bonds, and emerging market government debt occupy the top three spots. Longer corporates are next. US treasury ETFs occupy the bottom five spots.
Bond investors have two options: the bond portfolio above or investing in individual ETFs. For those that are comfortable investing in individual ETFs, the long-bond fund (VCLT) has sufficiently stabilized to warrant a position. For investors with a higher risk appetite, (JNK) now has support from the Federal Reserve, which explains its rise. But for most, the broad portfolio offered by the (BND)(BNDX) combination should be sufficient.
Finally, let’s look at the international performance table: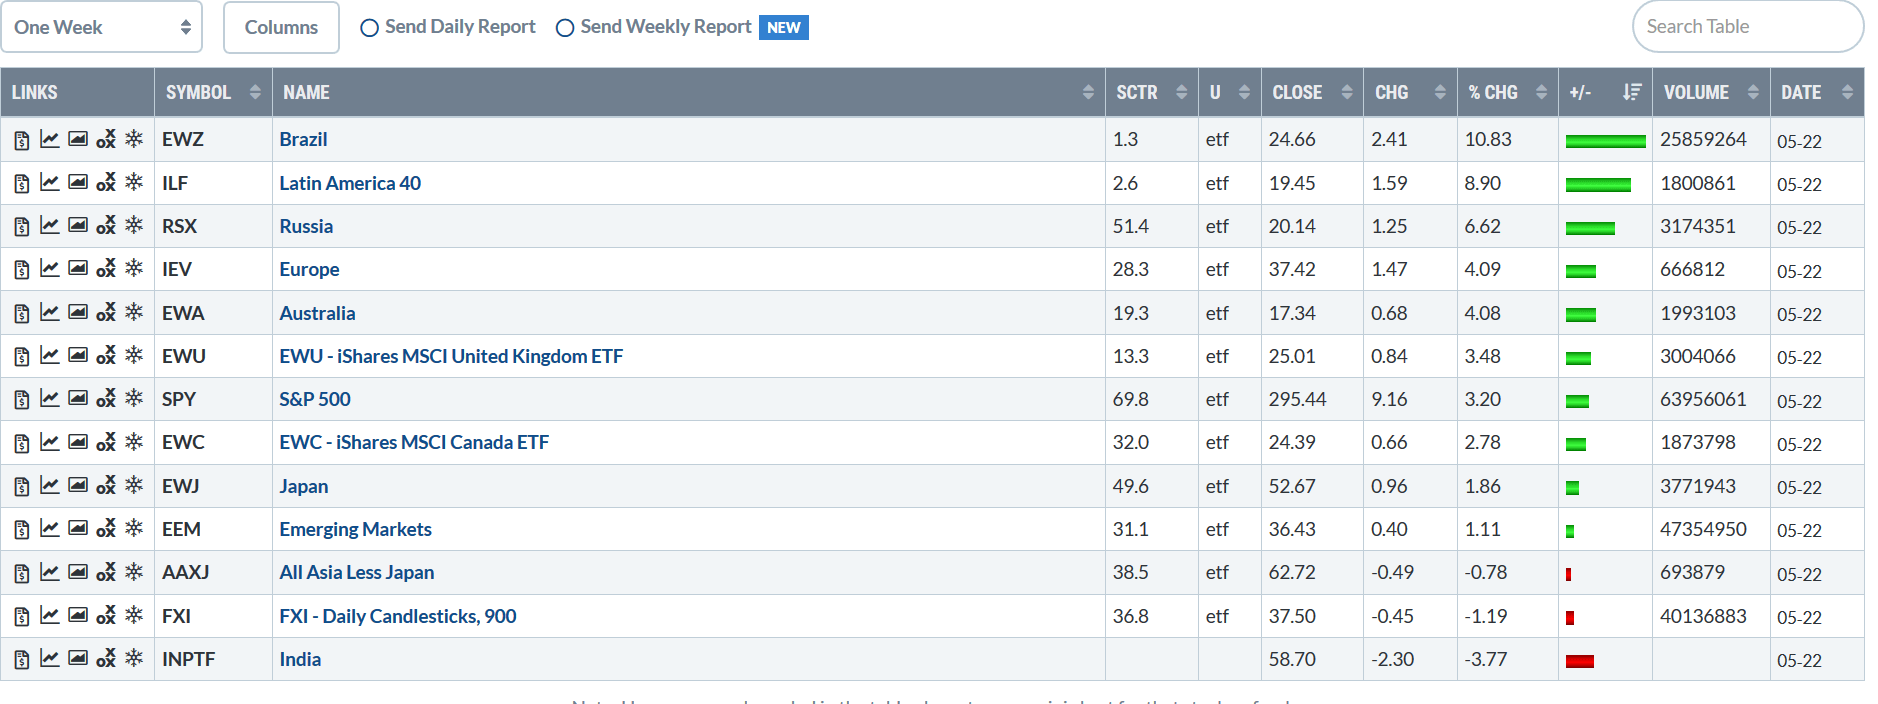 For the last several weeks, the top and bottom performers have flipped: one week China tops the list with Latin America at the bottom; the next week the positions are reversed. This week, it’s Latin America’s turn to be on top. Brazil gained nearly 11% while the broader regional ETF (which is heavily influenced by the EWZ ETF) advanced by almost 9%. At the bottom is China and the Asian rim, both of which were off modestly.
Despite the volatility, I still like the long China (FXI) and short Brazil (EWZ) trades. China is the first economy to emerge from lockdown. So far, the data has been fair. However, the central government is very strong and able to act unilaterally. I still suspect they we’ll see a large national stimulus. And, despite the increased friction due to the coronavirus starting in China, I think China will continue to assert itself onto the world stage. Here’s the chart: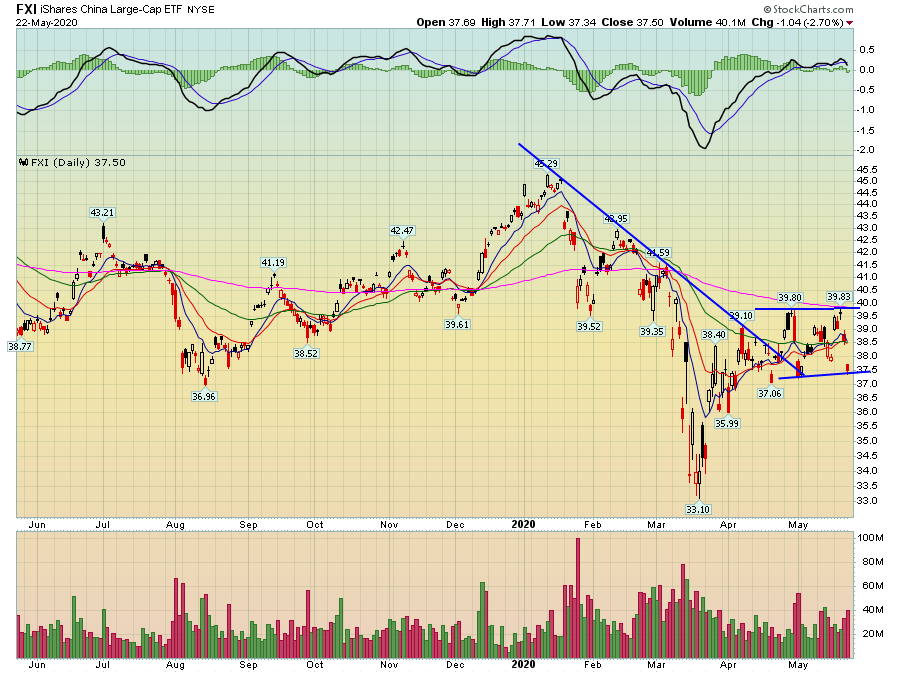 The (FXI) broke a downtrend in mid-April and has been consolidating sideways since. Prices are below the 200-day EMA.
Here’s the chart for the Brazil ETF: 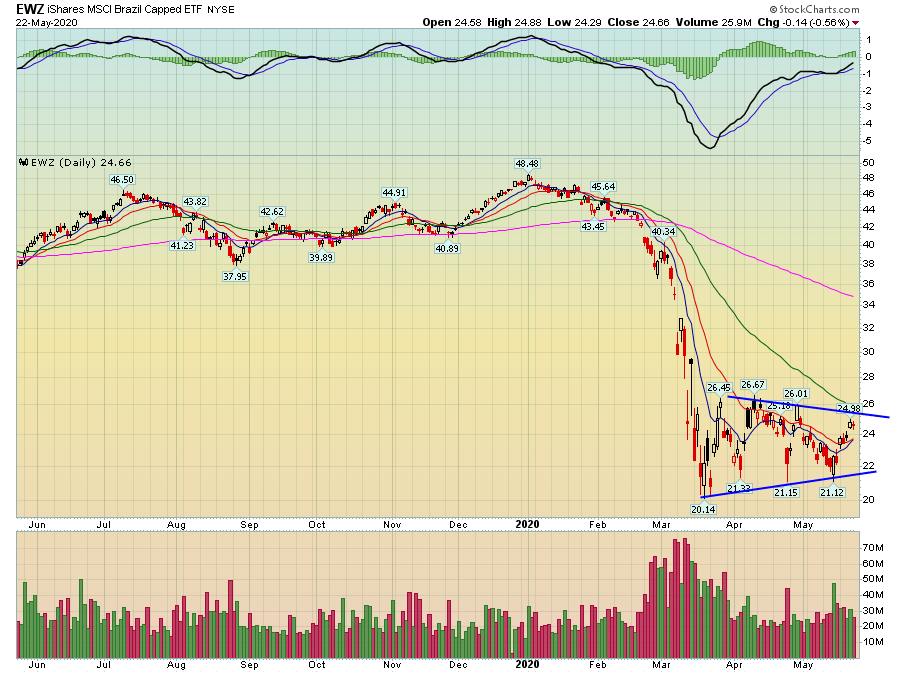 Brazil’s ETF has been consolidating at the bottom of a virus-induced sell-off. However, the internal situation is terrible. The virus response has been horrible. And as an emerging economy, it’s facing low commodity prices, capital flight, and a strong dollar. It’s difficult to see the country resuming its BRIC-darling status anytime soon.
That’s it for this week.
Research shows that stock-picking is a fool’s errand, making ETF investing the best way to participate in the market. The core portfolios use the classic stock/bond allocation model in various percentages depending on an investor’s risk tolerance. Investors who want the opportunity to goose returns can allocate to domestic sectors or international ETFs that show promise.
As always, I have no professional relationship with any reader and this is not specific investment advice for anyone. Read people who disagree with me and make up your own mind. In other words, buyer beware.
Disclosure: I/we have no positions in any stocks mentioned, and no plans to initiate any positions within the next 72 hours. I wrote this article myself, and it expresses my own opinions. I am not receiving compensation for it (other than from Seeking Alpha). I have no business relationship with any company whose stock is mentioned in this article.


