
This post was originally published on this site
Just about every investor is aware that a shortage of semiconductors and related equipment, including microprocessors and chips, are in short supply while demand is high. And yet the stocks of this critical group trade relatively low to the broader stock market.
Below is a list of favorite semiconductor stocks among Wall Street analysts, based on a deep dive into the holdings of five exchange traded funds focused on the industry.
The chip shortage isn’t the whole story — innovation and new business have lit fires under some of the best-known semiconductor companies. Shares of Nvidia Corp.
NVDA
were up 49% from the end of September through Nov. 8, while Advanced Micro Devices Inc.
AMD
was up 46%.
These articles help explain the big moves:
- Nvidia seeks to lead gold rush into the metaverse with new AI tools
- AMD stock notches best day in 15 months after company wins Facebook business
Industry appears cheaply valued
The PHLX Semiconductor Index
SOX
is considered the benchmark index for chip makers and companies that make equipment and systems used by them. It is tracked by the iShares Semiconductor ETF
SOXX,
which holds all 30 stocks in the index and is weighted by market capitalization.
This means Nvidia is the top holding, making up 9.7% of the portfolio, and the top five investments, which also include Broadcom Inc.
AVGO,
Intel Corp.
INTC,
Qualcomm Inc.
QCOM
and Texas Instruments Inc.
TXN,
account for 35.3% of the ETF’s assets. The sixth-ranked company, AMD, is 4.5% of the portfolio.
SOXX trades at a forward price-to-earnings ratio of 20.9, based on consensus estimates among analysts polled by FactSet, while the forward P/E for the S&P 500 Index
SPX
is 21.7. It’s not unusual for the semiconductors to trade at a discount. However, it is unusual for there to be a broad shortage of the industry’s products.
Here’s how SOXX has traded relative to the S&P 500 over the past 10 years:
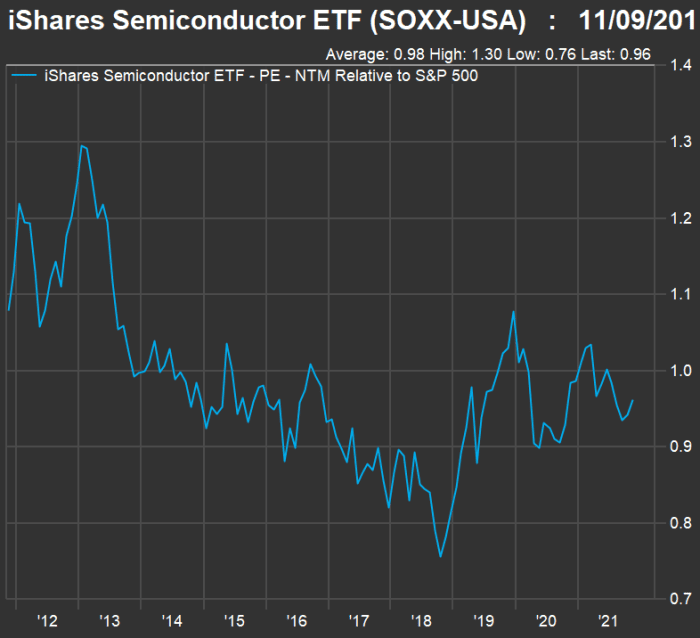
FactSet
Underlining the discount for the semiconductor group is the expectation that the group will increase its sales and earnings much more quickly over the next two years.
Here are expected compound annual growth rates (CAGR) for sales and earnings per share through 2023, based on weighted consensus estimates among analysts polled by FactSet:
| Estimated sales per share | ||||
| 2021 | 2022 | 2023 | Expected two-year sales CAGR | |
| iShares Semiconductor ETF | $77.72 | $85.64 | $94.61 | 10.3% |
| S&P 500 | $1,551.55 | $1,654.79 | $1,737.05 | 5.8% |
| 2021 | 2022 | 2023 | Expected two-year EPS CAGR | |
| iShares Semiconductor ETF | $22.17 | $23.97 | $35.59 | 26.7% |
| S&P 500 | $202.49 | $219.39 | $239.03 | 8.6% |
ETF deep dive
To look beyond the SOXX 30, we reviewed five ETFs that follow different approaches, to come up with a broader initial list of stocks:
-
SOXX is the largest, with $8.9 billion in total assets, and is cap-weighted, as described above. It holds the 30 largest U.S.-listed companies in the industry, including American depositary receipts (ADRs) of foreign companies, such as Taiwan Semiconductor Manufacturing Co.
TSM,
which are capped at 10% of the portfolio. Its annual expenses are 0.43% of assets under management. -
The VanEck Semiconductor ETF
SMH
has $6.9 billion in assets, with a cap-weighted portfolio of 25 stocks, selected though a scoring methodology that includes market cap and trading volume. It is even more concentrated than SOXX, with its top five holdings making up 44.4% of the portfolio, but its different weighting scheme means Taiwan Semiconductor is the top holding, at 14.5%. Its expense ratio is 0.35%. -
The SPDR S&P Semiconductor ETF
XSD
has $1.4 billion in assets, with a modified equal weighting of 40 stocks that “tilts its portfolio away from large, well-known companies and toward smaller growth ones,” according to FactSet. Its expense ratio is 0.35%. -
The Invesco Dynamic Semiconductors ETF
PSI
also leans toward smaller companies, with a modified equal-weighted $860 million portfolio of 30 stocks, reconstituted quarterly. Its expense ratio is 0.56%. -
The First Trust Nasdaq Semiconductor ETF
FTXL
has $95 million in assets and holds 30 of the most liquid semiconductor stocks listed in the U.S., “weighted according to factors related to value, volatility and growth,” according to FactSet. Its largest holding is Synaptics Inc.
SYNA,
which makes up 8.3% of the portfolio. Its expense ratio is 0.60%.
Together, removing duplicates, the five ETFs hold 65 stocks, with 62 covered by at least five analysts covered by FactSet.
Among the 62 companies, 25 have “buy” or equivalent ratings among at least 75% of the analysts. Only 10 of them are held by SOXX and only three (including Nvidia) are held by all five ETFs. Here they are, ranked by the implied 12-month upside, based on consensus price targets:
| Company | Share “buy” ratings | Closing price – Nov. 8 | Consensus price target | Implied 12-month upside potential | Forward P/E | Held by |
|
Kulicke & Soffa Industries Inc. KLIC |
80% | $58.15 | $83.00 | 43% | 8.8 | PSI |
|
MKS Instruments Inc. MKSI |
82% | $158.84 | $213.20 | 34% | 13.3 | SOXX, PSI |
|
Cirrus Logic Inc. CRUS |
77% | $79.61 | $106.36 | 34% | 14.3 | XSD, FTXL |
|
Micron Technology Inc. MU |
77% | $74.56 | $95.33 | 28% | 8.7 | SOXX, SMH, XSD, FTXL |
|
Taiwan Semiconductor Manufacturing Co. ADR TSM |
90% | $120.91 | $153.01 | 27% | 26.0 | SOXX, SMH |
|
Smart Global Holdings Inc. SGH |
100% | $58.24 | $72.00 | 24% | 9.1 | XSD |
|
United Microelectronics Corp. ADR UMC |
81% | $11.18 | $13.82 | 24% | 12.4 | SOXX |
|
Ultra Clean Holdings Inc. UCTT |
100% | $59.21 | $72.58 | 23% | 12.6 | PSI |
|
Allegro MicroSystems Inc. ALGM |
100% | $32.68 | $40.00 | 22% | 39.4 | XSD, PSI |
|
Onto Innovation Inc. ONTO |
100% | $90.50 | $105.00 | 16% | 20.1 | PSI |
|
SiTime Corp. SITM |
100% | $291.34 | $328.20 | 13% | 79.4 | XSD |
|
Axcelis Technologies Inc. ACLS |
100% | $61.85 | $68.50 | 11% | 17.5 | PSI |
|
ASML Holding N.V. ADR ASML |
77% | $849.93 | $935.00 | 10% | 44.6 | SOXX, SMH |
|
Diodes Inc. DIOD |
75% | $107.73 | $117.67 | 9% | 19.0 | XSD, PSI |
|
Teradyne Inc. TER |
84% | $143.89 | $153.24 | 6% | 22.8 | SOXX, SMH, FTXL |
|
Camtek Ltd. CAMT |
100% | $44.25 | $46.60 | 5% | 26.3 | PSI |
|
Analog Devices Inc. ADI |
79% | $184.46 | $193.71 | 5% | 26.0 | SOXX, SMH, XSD, PSI, FTXL |
|
Nova Ltd. NVMI |
100% | $128.77 | $135.00 | 5% | 30.3 | PSI |
|
Marvell Technology Inc. MRVL |
80% | $73.00 | $75.12 | 3% | 43.2 | SOXX SMH, XSD, FTXL |
|
Broadcom Inc. AVGO |
84% | $558.95 | $567.26 | 1% | 18.3 | SOXX, SMH, XSD, PSI, FTXL |
|
Synopsys Inc. SNPS |
88% | $342.91 | $341.14 | -1% | 46.8 | SMH |
|
Semtech Corp. SMTC |
91% | $90.52 | $88.30 | -2% | 32.4 | XSD |
|
MaxLinear Inc. MXL |
75% | $68.32 | $66.60 | -3% | 21.4 | XSD, PSI |
|
Impinj Inc. PI |
100% | $76.04 | $73.57 | -3% | 991.4 | XSD |
|
Nvidia Corp. NVDA |
81% | $308.04 | $243.44 | -21% | 71.6 | SOXX, SMH, XSD, PSI, FTXL |
| Source: FactSet | ||||||
A screen can only be the beginning of your research, if you wish to hold individual stocks rather than make broad investments using ETFs or mutual funds. Click on the tickers for more about each company. Click here for Tomi Kilgore’s detailed guide to the wealth of information for free on the MarketWatch quote page.
As you can see on the table, some of the stocks, despite being so well-regarded, have gotten ahead of their one-year price targets. Nvidia is a good example. Why do so many analysts rate it a buy, despite believing the stock is overheated? Because they are looking at years beyond a 12-month target.
Don’t miss: 5 infrastructure stocks to buy now that Biden’s bill has been passed, according to Jefferies

