
This post was originally published on this site
The S&P 500 index closed at another all-time high on Wednesday, its 51st record this year. Success has been widespread, with 250 of the S&P 500 outperforming the index as a whole. But there are always some stocks left behind, including the list of highly regarded names below.
First, consider how well the S&P 500
SPX,
has been performing. It was up 20.8% for 2021 through Aug. 25, with dividends reinvested. That follows returns of 32.5% in 2020 and 31.5% in 2019. The index has returned 88.1% since the end of 2018. All performance figures in this article include reinvested dividends.
If we even out the numbers, the S&P 500 has returned 65% for three years, 128% for five years and 375% for 10 years, underlining the case for stocks as the ideal asset class for most long-term investors. Performance slips if we go out 15 years to cover the 2008 financial crisis, with a return of 367%.
Stocks left behind in 2021 that may have great potential for investors
Through Aug. 25, 58 of the S&P 500 components were down for 2021. Among those stocks, 33 have majority “buy” ratings among analysts polled by FactSet. Here are the 20 that the analysts expect to perform the best over the next 12 months, along with their forward price-to-earnings ratios:
| Company | Total return – 2021 | Share “buy” ratings | Closing price – Aug. 25 | Consensus price target | Implied 12-month upside potential | Forward P/E |
|
Micron Technology Inc. MU, |
-2% | 85% | $74.04 | $117.79 | 59% | 7.0 |
|
Las Vegas Sands Corp. LVS, |
-27% | 63% | $43.24 | $64.38 | 49% | 44.7 |
|
Activision Blizzard Inc. ATVI, |
-13% | 91% | $80.81 | $116.04 | 44% | 21.1 |
|
Global Payments Inc. GPN, |
-23% | 81% | $165.25 | $228.69 | 38% | 18.6 |
|
Incyte Corp. INCY, |
-13% | 60% | $75.76 | $102.47 | 35% | 32.2 |
|
NOV Inc. NOV, |
-3% | 59% | $13.26 | $17.58 | 33% | N/A |
|
Take-Two Interactive Software Inc. TTWO, |
-23% | 70% | $160.66 | $212.87 | 32% | 34.2 |
|
FMC Corp. FMC, |
-18% | 75% | $92.90 | $122.89 | 32% | 12.8 |
|
Vertex Pharmaceuticals Inc. VRTX, |
-15% | 78% | $201.33 | $262.14 | 30% | 16.2 |
|
Newmont Corp. NEM, |
-3% | 71% | $56.91 | $73.57 | 29% | 16.3 |
|
Lamb Weston Holdings Inc. LW, |
-15% | 78% | $66.09 | $85.43 | 29% | 26.5 |
|
Qualcomm Inc. QCOM, |
-5% | 64% | $143.87 | $184.15 | 28% | 15.9 |
|
Fidelity National Information Services Inc. FIS, |
-8% | 69% | $130.01 | $165.93 | 28% | 18.3 |
|
Penn National Gaming Inc. PENN, |
-7% | 67% | $79.92 | $101.50 | 27% | 26.3 |
|
Baxter International Inc. BAX, |
-7% | 53% | $73.80 | $92.56 | 25% | 19.5 |
|
V.F. Corp. VFC, |
-9% | 68% | $77.06 | $96.59 | 25% | 23.1 |
|
Zimmer Biomet Holdings Inc. ZBH, |
-2% | 79% | $150.39 | $187.58 | 25% | 18.1 |
|
Constellation Brands Inc. Class A STZ, |
-1% | 71% | $214.98 | $265.86 | 24% | 20.6 |
|
Wynn Resorts Ltd. WYNN, |
-11% | 54% | $100.84 | $123.45 | 22% | N/A |
|
Electronic Arts Inc. EA, |
-1% | 72% | $141.86 | $172.75 | 22% | 20.4 |
| Source: FactSet | ||||||
You can click on the tickers for more about each company.
The list is meant to provide information — it is not investment advice. Here’s some advice: If you see any stock of interest here, do your own research to form your own opinion about the company’s strategy and its long-term prospects.
Market-cap weighting is less important this year
The S&P 500 is weighted by market capitalization, which means its performance can be dominated by the largest stocks in the index.
The SPDR S&P 500 ETF
SPY,
tracks the benchmark index by holding shares of all 500 companies and charging nominal annual fees totaling 0.09% of assets. Its five largest holdings (including two common-share classes for Alphabet Inc.
GOOG,
GOOGL,
) make up 22.6% of the portfolio. Here’s how they have performed:
| Company | Total return – 2021 | Total return – 2020 | Total return – 2019 | Total return – 3 Years | Total return – 5 Years | % of SPY portfolio |
|
Apple Inc. AAPL, |
12.3% | 82% | 89% | 183.4% | 488.3% | 6.2% |
|
Microsoft Corp MSFT, |
36.7% | 43% | 58% | 188.9% | 461.1% | 6.0% |
|
Amazon.com Inc. AMZN, |
1.3% | 76% | 23% | 73.1% | 334.5% | 3.7% |
| Facebook Inc. Class A | 34.9% | 33% | 57% | 110.9% | 197.4% | 2.3% |
|
Alphabet Inc. Class A GOOGL, |
62.1% | 31% | 28% | 129.8% | 259.1% | 2.2% |
|
Alphabet Inc. Class C GOOG, |
63.2% | 31% | 29% | 134.2% | 271.6% | 2.1% |
| Source: FactSet | ||||||
A very good 2021 so far, but you can see that Apple Inc.
AAPL,
and especially Amazon.com Inc.
AMZN,
have underperformed the index this year.
This brings up another fascinating development related to cap-weighting that underscores how widespread good stock performance has been during 2021. This year, the Invesco S&P 500 Equal Weight ETF
RSP,
has outperformed SPY and the S&P 500:
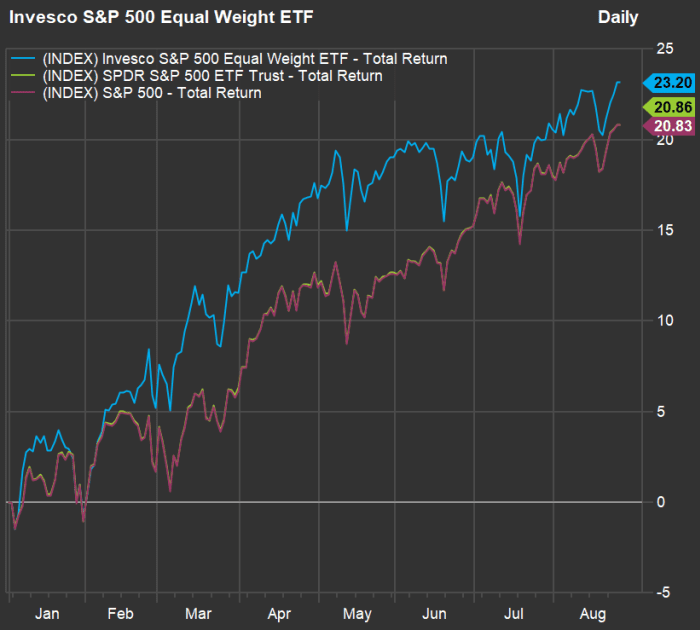
FactSet
The weighted forward P/E ratio for the S&P 500 is 21.1, according to FactSet. For comparison, the Invesco S&P 500 Equal Weight ETF
RSP,
has a forward P/E is 18.4.
The equal-weighted approach is, arguably, less risky than the cap-weighted approach, because an investor avoids such a large concentration in a handful of stocks. But during the S&P 500’s strong run in recent years, the equal-weighted portfolio has underperformed the index. Here are average annual returns for various periods:
| Fund or index | Average return – 3 years | Average return – 5 years | Average return – 10 years | Average return – 15 years | Average return – 17 years |
|
Invesco S&P 500 Equal Weight ETF RSP, |
15.7% | 15.2% | 15.7% | 10.8% | 11.0% |
|
SPDR S&P 500 ETF Trust SPY, |
18.1% | 17.8% | 16.7% | 10.8% | 10.7% |
|
S&P 500 SPX, |
18.2% | 17.9% | 16.9% | 10.9% | 10.8% |
| Source: FactSet | |||||
RSP was established in August 2003, so the longest period for the average returns shown above is 17 years. For that period, the equal-weighed has approach performed best, while it has underperformed the cap-weighted index in all the more recent periods. Click here for Mark Hulbert’s analysis of the weighted vs. unweighted approaches going back to 1970.
Don’t miss: These stocks can defend your investment portfolio from inflation


