
This post was originally published on this site
Energy is the best-performing stock-market sector this year. Given today’s strong economic growth and inflation, many believe oil prices could remain at current levels for years or maybe even move higher.
Below are two screens of stocks derived from the holdings of three exchange-traded funds that invest in oil and natural gas companies.
An oil price review
First, here’s a chart showing the price movement of forward-month delivery contracts for West Texas Intermediate Crude Oil
CL00,
over the past 10 years:
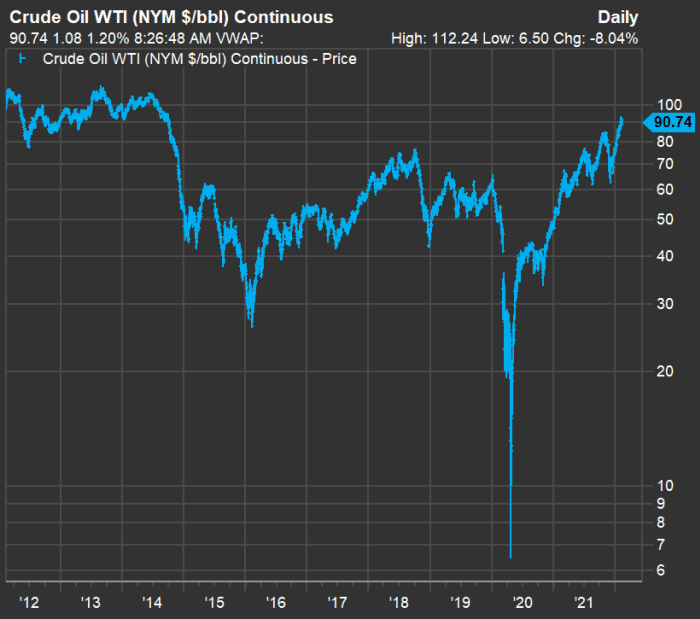
FactSet
That steep but brief plunge on the chart is April 2020, when demand for oil tanked during the early days of the COVID-19 pandemic, storage sites were full and those holding front-month futures contracts essentially had to pay people to take the oil off their hands.
Oil price expectations from here
So what lies ahead for oil prices?
In a report provided to clients on Feb. 10, analysts at BCA Research said they believe prices will rise over the next decade in the face of increasing demand and declining supplies. Those threats to supplies include government action that curbs fossil-fuel production as well as “climate activism at the board level at major energy suppliers and in the courtroom.”
In other words, the best intentions to reduce carbon emissions can push oil pries higher because alternate energy sources take a long time to be available in sufficient quantity to curb demand for fossil fuels.
The BCA analysts favor long-term exposure to oil through ETFs.
Three energy ETFs
If you agree with the above scenario you might want to consider a broad investment in the sector through one or more ETFs. Here’s a quick look at three of them:
-
The Energy Select Sector SPDR ETF
XLE,
+2.06%
tracks the energy sector of the S&P 500
SPX,
-1.90% .
That’s a group of 21 stocks. This is the only sector of the S&P 500 that is up this year — a total return of 24.4% through Feb. 9, with dividends reinvested. XLE has $35.7 billion in assets and annual expenses of 0.12% of assets. It is highly concentrated, with shares of Exxon Mobil Corp.
XOM,
+1.35%
and Chevron Corp.
CVX,
+1.85%
making up 44% of the portfolio. -
The iShares Global Energy ETF
IXC,
+1.74%
holds 46 stocks, including all the stocks held by XLE. It brings in large non-U.S. companies, such as Shell PLC
SHEL,
+1.02% SHEL,
+1.23% ,
TotalEnergies SE
TTE,
+0.62% TTE,
-0.61%
and BP PLC
BP,
+1.58% BP,
+2.13% .
(For the three companies just listed, the first ticker is the local one, the second is the American depositary receipt, or ADR. Many of the locally traded non-U.S. companies listed below also have ADRs.) IXC has $1.8 billion in assets, with an expense ratio of 0.43%. The fund’s largest two holdings are Exxon Mobil and Chevron, which together make up 25.5% of the portfolio -
The iShares S&P/TSX Capped Energy Index ETF
XEG,
+2.48%
holds 20 stocks of Canadian energy producers. It is also heavily concentrated, with the largest three holdings, Canadian Natural Resources Ltd
CNQ,
+2.48% .
, Suncor Energy Inc.
SU,
+3.29%
and Cenovus Energy Inc.
CVE,
+3.07%
making up half the portfolio. The ETF has 2 billion Canadian dollars in total assets, with an expense ratio of 0.63%.
You might wonder why a foreign single-country ETF is included in the list, but Canada stands out with its expansion of fossil-fuel production. The iShares S&P/TSX Capped Energy Index ETF has outperformed the other two ETFs in recent years, while underperforming longer term.
Here’s a comparison of total returns, with dividends reinvested, for the three ETFs and the SPDR S&P 500 ETF Trust
SPY,
through Feb. 9:
| S&P 500 sector | 2022 | 1 year | 3 years | 5 years | 10 years | 15 years | 20 years |
| Energy Select Sector SPDR Fund | 24.1% | 64% | 31% | 20% | 33% | 81% | 355% |
| iShares Global Energy ETF | 21.7% | 55% | 22% | 24% | 18% | 49% | 262% |
| iShares S&P/TSX Capped Energy Index ETF | 19.0% | 98% | 49% | 11% | -10% | -11% | 177% |
| SPDR S&P 500 ETF Trust | -3.7% | 19% | 78% | 117% | 310% | 328% | 510% |
| Source: FactSet | |||||||
The iShares S&P/TSX Capped Energy Index ETF has shined over the past one and three years. You can also see how dramatically the oil price decline from mid 2014 through early 2016 hurt the energy sector’s long-term performance.
A look ahead for the ETFs
Here are forward price-to-earnings ratios for the three energy ETFs and SPY, along with expected compound annual growth rates (CAGR) for revenue and earnings per share through 2023, based on consensus estimates among analysts polled by FactSet:
| S&P 500 sector | Ticker | Forward P/E | Two-year estimated sales CAGR | Two-year estimated EPS CAGR |
| Energy Select Sector SPDR Fund |
XLE, |
12.7 | 3.8% | 14.1% |
| iShares Global Energy ETF |
IXC, |
10.7 | 4.3% | 9.4% |
| iShares S&P/TSX Capped Energy Index ETF |
XEG, |
8.6 | 4.1% | 9.7% |
| SPDR S&P 500 ETF Trust |
SPY, |
20.2 | 6.5% | 9.1% |
| Source: FactSet | ||||
From the forward P/E ratios, the energy ETFs might be considered cheap relative to SPY, however, they “earned” investors’ mistrust during the long decline of stock prices from mid-2014 through early 2016, and, of course, early in the pandemic.
Analysts don’t expect to see spectacular revenue growth for the energy portfolios over the next two years. However, they do expect better earnings growth than they do for the broad U.S. market — especially for XLE.
Two energy stock screens
The three energy ETFs together hold 63 stocks. The two screens below show which ETF or ETFs hold each stock.
First screen: dividend yields
Given what appears to be a healthy environment for oil prices, a broad round of dividend cuts, such as those we saw early in the pandemic, appears unlikely. With that in mind, the first screen of the 63 stocks held by the three ETFs is simply by dividend yield.
Here are the 21 stocks held by the three ETFs with the highest dividend yield (over 4%), along with a summary of analysts’ opinions of the stocks. Share prices and consensus price targets are in the currencies of the country where the stocks are listed.
| Company | Ticker | Country | Dividend yield | Share “buy” ratings | Closing price – Feb. 9 | Cons. Price target | Implied upside potential | Held by |
| Petroleo Brasileiro SA ADR Pfd |
PBR.A, |
Brazil | 16.05% | 57% | 12.26 | 14.79 | 21% | IXC |
| Petroleo Brasileiro SA ADR |
PBR, |
Brazil | 14.66% | 50% | 13.42 | 14.09 | 5% | IXC |
| Enbridge Inc. |
ENB, |
Canada | 6.32% | 57% | 54.44 | 55.16 | 1% | IXC |
| Kinder Morgan Inc Class P |
KMI, |
U.S. | 6.22% | 21% | 17.37 | 19.15 | 10% | XLE, IXC |
| Peyto Exploration & Development Corp. |
PAY, |
Canada | 6.09% | 67% | 9.85 | 13.83 | 40% | XEG |
| Pembina Pipeline Corp. |
PPL, |
Canada | 6.07% | 39% | 41.49 | 43.97 | 6% | IXC |
| GALP Energia SGPS SA Class B |
GALP, |
Portugal | 5.99% | 52% | 10.02 | 11.72 | 17% | IXC |
| ONEOK, Inc. |
OKE, |
U.S. | 5.88% | 29% | 63.64 | 66.00 | 4% | XLE, IXC |
| Williams Cos., Inc. |
WMB, |
U.S. | 5.58% | 68% | 30.47 | 32.09 | 5% | XLE, IXC |
| Freehold Royalties Ltd. |
FRU, |
Canada | 5.41% | 87% | 13.30 | 16.60 | 25% | XEG |
| TC Energy Corp. |
TRP, |
Canada | 5.28% | 35% | 65.85 | 67.32 | 2% | IXC |
| Eni S.p.A. |
ENI, |
Italy | 5.06% | 67% | 13.25 | 14.81 | 12% | IXC |
| TotalEnergies SE |
TTE, |
France | 5.04% | 71% | 52.40 | 55.55 | 6% | IXC |
| ENEOS Holdings, Inc. |
5020, |
Japan | 4.79% | 78% | 459.00 | 550.67 | 20% | IXC |
| Inpex Corp. |
1605, |
Japan | 4.71% | 78% | 1,147.00 | 1,371.11 | 20% | IXC |
| Suncor Energy Inc. |
SU, |
Canada | 4.59% | 64% | 36.59 | 43.50 | 19% | IXC, XEG |
| Exxon Mobil Corp. |
XOM, |
U.S. | 4.46% | 35% | 79.00 | 80.75 | 2% | XLE, IXC |
| Valero Energy Corp. |
VLO, |
U.S. | 4.41% | 81% | 88.84 | 94.41 | 6% | XLE, IXC |
| Chevron Corp. |
CVX, |
U.S. | 4.12% | 74% | 137.79 | 144.41 | 5% | XLE, IXC |
| Phillips 66 |
PSX, |
U.S. | 4.11% | 79% | 89.45 | 99.31 | 11% | XLE, IXC |
| OMV AG |
OMV, |
Austria | 4.07% | 50% | 56.46 | 62.51 | 11% | IXC |
| Source: FactSet | ||||||||
You can click on the tickers for more about each company.
Then read Tomi Kilgore’s detailed guide to the wealth of information available for free on the MarketWatch quote page.
Don’t assume dividends are distributed quarterly, as is common for U.S. stocks. Some companies only distribute annually.
Also note that the highest-yielding stocks on the list are American depositary receipts of Petroleo Brasileiro SA (known as “Petrobas”) common shares
PBR,
and preferred shares
PBR.A,
Unlike traditional preferred stocks issued in the U.S., this Petrobas preferred issue has no par value. (More information about the Petrobas ADRs is available in this filing from Dec. 21, 2021 with the Securities and Exchange Commission.)
Any stock with a dividend yield above 14% has a built-in warning. If investors expected the dividend to be safe, the share price would be higher and the dividend yield lower. So this is an investment that might best be left to professionals or other sophisticated investors.
Second screen: analysts’ picks
Going back to our combined list of 63 stocks, here are the 18 favored by at least 80% of analysts polled by FactSet, sorted by 12-month upside potential as implied by consensus price targets. You can see that analysts favor many of the Canadian oil and gas producers in lockstep:
| Company | Ticker | Country | Share “buy” ratings | Closing price – Feb. 9 | Cons. Price target | Implied 12-month upside potential | Dividend yield | Held by |
| Birchcliff Energy Ltd. |
BIR, |
Canada | 88% | 6.63 | 9.78 | 48% | 0.60% | XEG |
| Tourmaline Oil Corp. |
TOU, |
Canada | 100% | 45.59 | 63.40 | 39% | 1.58% | XEG |
| Parex Resources Inc. |
PXT, |
Canada | 100% | 26.85 | 36.73 | 37% | 1.94% | XEG |
| ARC Resources Ltd. |
ARX, |
Canada | 100% | 14.49 | 19.42 | 34% | 2.76% | XEG |
| Whitecap Resources Inc. |
WCP, |
Canada | 93% | 9.02 | 11.69 | 30% | 2.99% | XEG |
| Enerplus Corporation |
ERF, |
Canada | 85% | 14.77 | 19.07 | 29% | 1.10% | XEG |
| Secure Energy Services Inc. |
SES, |
Canada | 100% | 6.12 | 7.81 | 28% | 0.49% | XEG |
| Tamarack Valley Energy Ltd. |
TVE, |
Canada | 85% | 4.90 | 6.25 | 28% | 2.03% | XEG |
| Freehold Royalties Ltd. |
FRU, |
Canada | 87% | 13.30 | 16.60 | 25% | 5.41% | XEG |
| Cenovus Energy Inc. |
CVE, |
Canada | 100% | 19.09 | 23.29 | 22% | 0.73% | IXC, XEG |
| Santos Limited |
STO, |
Australia | 88% | 7.50 | 8.90 | 19% | 1.95% | IXC |
| Shell PLC |
SHEL, |
United Kingdom | 80% | 20.28 | 23.87 | 18% | 3.25% | IXC |
| Diamondback Energy, Inc. |
FANG, |
United States | 85% | 128.88 | 144.36 | 12% | 1.55% | XLE, IXC |
| ConocoPhillips |
COP, |
United States | 86% | 92.95 | 102.25 | 10% | 1.98% | XLE, IXC |
| Pioneer Natural Resources Company |
PXD, |
United States | 82% | 221.82 | 241.53 | 9% | 3.08% | XLE, IXC |
| Schlumberger NV |
SLB, |
United States | 90% | 39.40 | 42.66 | 8% | 1.27% | XLE, IXC |
| Valero Energy Corp. |
VLO, |
United States | 81% | 88.84 | 94.41 | 6% | 4.41% | XLE, IXC |
| EOG Resources, Inc. |
EOG, |
United States | 82% | 113.31 | 118.03 | 4% | 2.65% | XLE, IXC |
| Source: FactSet | ||||||||
As always, do your own research and form your own opinions about which investments, whether through ETFs or other funds or a combination of those and/or individual stocks, match your investment objectives.
Plus: 5 reasons to buy the dips when inflation fears trigger panic in the stock market
And: Netflix vs. Facebook: Which is the better stock after those shocking earnings?


