
This post was originally published on this site
You might be surprised to hear that small-cap stocks are trading inexpensively compared with their larger peers. Indeed, they are — if the data are confined to profitable companies.
And small caps are expected to grow their earnings more quickly than larger companies. So this may be an excellent buying point for long-term investors.
Small-cap stocks, as represented by the S&P Small Cap 600 Index
SML,
have outperformed large-cap stocks this year:
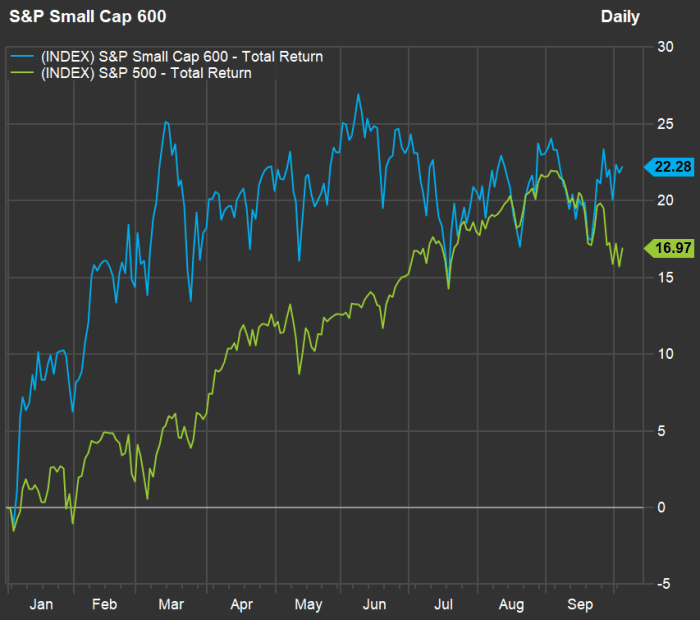
FactSet
In an interview, Timothy Skiendzielewski, co-manager of abrdn’s $2.6 billion U.S. Small Cap Equity Strategy, discussed six smaller companies that he argues are set up for long-term growth. They are listed below.
Skiendzielewski, who is based in Philadelphia, manages the $1.1 billion Aberdeen U.S. Small Cap Equity Fund. The fund’s Institutional share class
GSCIX,
is rated four stars (of five) by Morningstar, while Class A shares
GSXAX,
have a three-star rating.
Abrdn is the new name of Standard Life Aberdeen, which is based in Edinburgh, Scotland.
Smaller companies with big profit growth
The strategy’s benchmark is the Russell 2000 Index
RUT,
The forward price-to-earnings ratio for the iShares Russell 2000 ETF
IWM,
is 25.7, compared with 20.4 for the large-cap S&P 500 Index
SPX,
based on weighted aggregate earnings estimates for the next 12 months, among analysts polled by FactSet. So, by these measures, the small-cap Russell 2000 seems more pricey.
But the Russell 2000 includes many early-stage companies that aren’t expected to show profits over the next 12 months. The S&P Small Cap 600 Index trades lower because most of its companies are profitable. Standard & Poor’s criteria for initial inclusion in the index includes positive earnings for the most recent quarter and for the sum of the most recent four quarters. So it is a far more selective list than the Russell 2000, and its forward P/E is 15.4 — much lower than that of the S&P 500.
And the small-cap group is expected to increase earnings more quickly than the large caps. Stripping out unprofitable companies from the Russell 2000 index, Jefferies analyst Steven DeSanctis estimates small-cap companies will increase their 2021 earnings by 42% from their pre-COVID 2019 levels, while the S&P 500, on the same basis, will increase earnings by 26%.
Skiendzielewski sees “a relatively large discount” for small-cap stocks, which “have typically traded anywhere from an 8% to 10% premium to large caps.”
Zeroing in on six small-cap stocks
Skiendzielewski says investors are worrying too much about small caps, in light of the resurgence of coronavirus infections. Even as winter approaches, he doesn’t expect an economic shutdown on a scale similar to the one that took place during the first half of 2020.
He also sees the current environment as one that is especially good for active managers seeking overlooked long-term plays among small-cap stocks, which may only be covered by few Wall Street analysts.
Here are the six stocks he mentioned during the interview.
-
Health Catalyst Inc.
HCAT,
-3.87%
develops software used by hospitals. “They essentially allow hospitals to dig into the data that comes in from all systems and make decisions” on how to source materials and manage staff and hospital populations, Skiendzielewski said. -
Conmed Corp.
CNMD,
+0.17%
makes medical devices used for elective or orthopedic surgery. While those are not necessarily areas for dynamic growth, Skiendzielewski is enthusiastic about technology that the company “acquired and further developed” that is used to filter smoke created during cauterization procedures. This type of equipment has been mandated in some states. He said Conmed “has leading market share and best technology” in that area. -
Grid Dynamics Holdings Inc.
GDYN,
-3.44%
helps companies move their networks to cloud-oriented models, making the best use of various components. Skiendzielewski described it as a “high-growth, high-margin business.” -
CI Financial Corp.
CIX,
-0.12%
is a wealth manager based in Toronto. The firm has been expanding into the U.S. through acquisitions, which should help it become more profitable as it shifts to higher-margin areas of the industry, Skiendzielewski said. The stock trades for only 7.8 times the consensus earnings-per-share estimate for the next 12 months, among analysts polled by FactSet. He expects the company’s expansion and improving profit margins to lead to an expansion of the P/E valuation. -
Graphic Packaging Holding Co.
GPK,
-2.44%
is another stock with a low forward P/E multiple: 12.6. The company makes various types of paper-based packaging, including cups, takeout food containers and various types of boxes. “End markets are relatively stable and management recently initiated a growth campaign aimed at accelerating plastic-to-paper conversions,” Skiendzielewski said. He expects increasing demand for paper takeout packaging to lead to a P/E multiple expansion. -
Aritzia Inc.
ATZ,
+0.31%
is based in Vancouver, Canada, and designs and sells clothing through a chain of stores in Canada and the U.S. It operates in what Skiendzielewski calls the “affordable luxury space.” He pointed to a competitive advantage for Aritzia: The company presents a mix of products to its customers, including “proven winners,” that it will freshen up with small changes, as well as “shallow testing” of new fashion items, to limit risk while attempting to appeal to ever-changing tastes. This has allowed Aritzia to deliver steady increases in comparable-store sales, Skiendzielewski said.
For the six stocks he mentioned during the interview, here are three tables showing sales and earnings estimates, and then a summary of Wall Street analysts’ opinions. The first table includes market capitalizations and sales estimates:
| Company | Market cap. | Est. sales – 2021 | Est. sales – 2022 | Est. sales – 2023 | Est. sales – 2024 | Expected sales CAGR |
|
Health Catalyst Inc. HCAT, |
$2,434 | $239 | $290 | $355 | $434 | 22.0% |
|
Conmed Corp. CNMD, |
$3,808 | $1,026 | $1,121 | $1,193 | $1,314 | 8.6% |
|
Grid Dynamics Holdings Inc. Class A GDYN, |
$1,800 | $190 | $233 | $283 | N/A | 22.1% |
|
CI Financial Corp. CIX, |
$5,150 | $2,181 | $2,385 | $2,722 | N/A | 11.7% |
|
Graphic Packaging Holding Co. GPK, |
$5,948 | $7,042 | $8,141 | $8,200 | N/A | 7.9% |
|
Aritzia Inc. ATZ, |
$3,566 | $921 | $1,092 | N/A | N/A | 18.6% |
| Source: FactSet | ||||||
Click on the tickers for more about each company. Click here for Tomi Kilgore’s detailed guide to the wealth of information on MarketWatch quote page.
Two of the companies, CI Financial Corp.
CIX,
and Aritzia Inc.
ATZ,
are based in Canada, and the ticker symbols used here are for their shares listed on the Toronto Stock Exchange. The market capitalization and sales figures on the first table are all in millions of U.S. dollars.
For the sales growth calculations, the table includes three-year expected compound annual growth rates, based on consensus estimates through 2024 for the first two companies — Health Catalyst and Conmed. For Grid Dynamics, CI Financial and Graphic Packaging , consensus sales estimates are available through 2023, so the table includes two-year sales CAGR. For Aritzia, full-calendar-year sales estimates are available only through 2022, with analysts expecting an increase of 18.6%.
Here are earnings-per-share estimates for the group, in local currencies:
| Company | Est. EPS – 2021 | Est. EPS – 2022 | Est. EPS – 2023 | Est. EPS – 2024 | Expected EPS CAGR |
|
Health Catalyst Inc. HCAT, |
-0.48 | -0.30 | 0.07 | 0.49 | N/A |
|
Conmed Corp. CNMD, |
3.19 | 3.77 | 4.38 | 5.00 | 16.1% |
|
Grid Dynamics Holdings Inc. Class A GDYN, |
0.30 | 0.35 | 0.44 | N/A | 13.8% |
|
CI Financial Corp. CIXX, |
3.09 | 3.45 | 3.71 | N/A | 6.3% |
|
Graphic Packaging Holding Co. GPK, |
1.26 | 1.75 | 1.95 | N/A | 15.9% |
|
Aritzia Inc. ATZ, |
0.91 | 1.30 | N/A | N/A | N/A |
| Source: FactSet | |||||
This table includes expected three-year EPS CAGR for Grid Dynamics, then two-year CAGAR for the next three companies, and a simple estimated 2022 EPS increase for Aritzia. For Health Catalyst, there is no EPS growth rate because the company is expected to show full-year net losses for 2021 and 2022.
Here’s a summary of Wall Street analsyts’ opinions about the six stocks, with share prices and consensus 12-month price tartets in local currencies:
| Company | Share “buy” ratings | No. of analysts covering | Closing price – Oct. 5 | Cons. price target | Implied 12-month upside potential | Forward P/E |
| Health Catalyst Inc. | 100.00% | 12 | 47.87 | 66.00 | 38% | N/A |
| Conmed Corp. | 75.00% | 8 | 130.56 | 156.57 | 20% | 38.1 |
| Grid Dynamics Holdings Inc. Class A | 100.00% | 7 | 28.98 | 27.50 | -5% | 93.7 |
| CI Financial Corp. | 80.00% | 10 | 25.58 | 29.22 | 14% | 7.8 |
| Graphic Packaging Holding Co. | 69.23% | 13 | 19.37 | 22.25 | 15% | 12.6 |
| Aritzia Inc. | 100.00% | 9 | 41.53 | 42.88 | 3% | 36.5 |
| Source: FactSet | ||||||
Two of the six stocks Skiendzielewski mentioned have low forward P/E ratios compared to those of the indexes, above, while the other four either have high valuations or in the case of Health Catalyst Inc.
HCAT,
no forward P/E because the company is not expected by analysts to become profitable until the first quarter of 2023.
Fund performance
Here’s how the Aberdeen U.S. Small Cap Equity Fund’s institutional share class
GSCIX,
and its Class A shares
GSXAX,
have performed through Oct. 5, excluding any sales charges, for various periods against the Morningstar Small Growth fund category and the Russell 2000 Index:
| Fund, category or index | Total return – 1 year | Avg. return – 3 years | Avg. return – 5 years | Avg return – 10 years |
| Aberdeen U.S. Small Cap Equity Fund – Institutional Class | 44.79% | 18.33% | 15.87% | 17.73% |
| Aberdeen U.S. Small Cap Equity Fund – Class A | 44.29% | 17.93% | 15.49% | 17.35% |
| Morningstar Small Growth category | 34.98% | 17.86% | 18.46% | 16.26% |
| Russell 2000 Index | 42.27% | 12.38% | 13.75% | 14.51% |
| Sources: Morningstar, FactSet | ||||
Don’t miss: Bank stocks are cheap — here are the 20 best players in the industry
